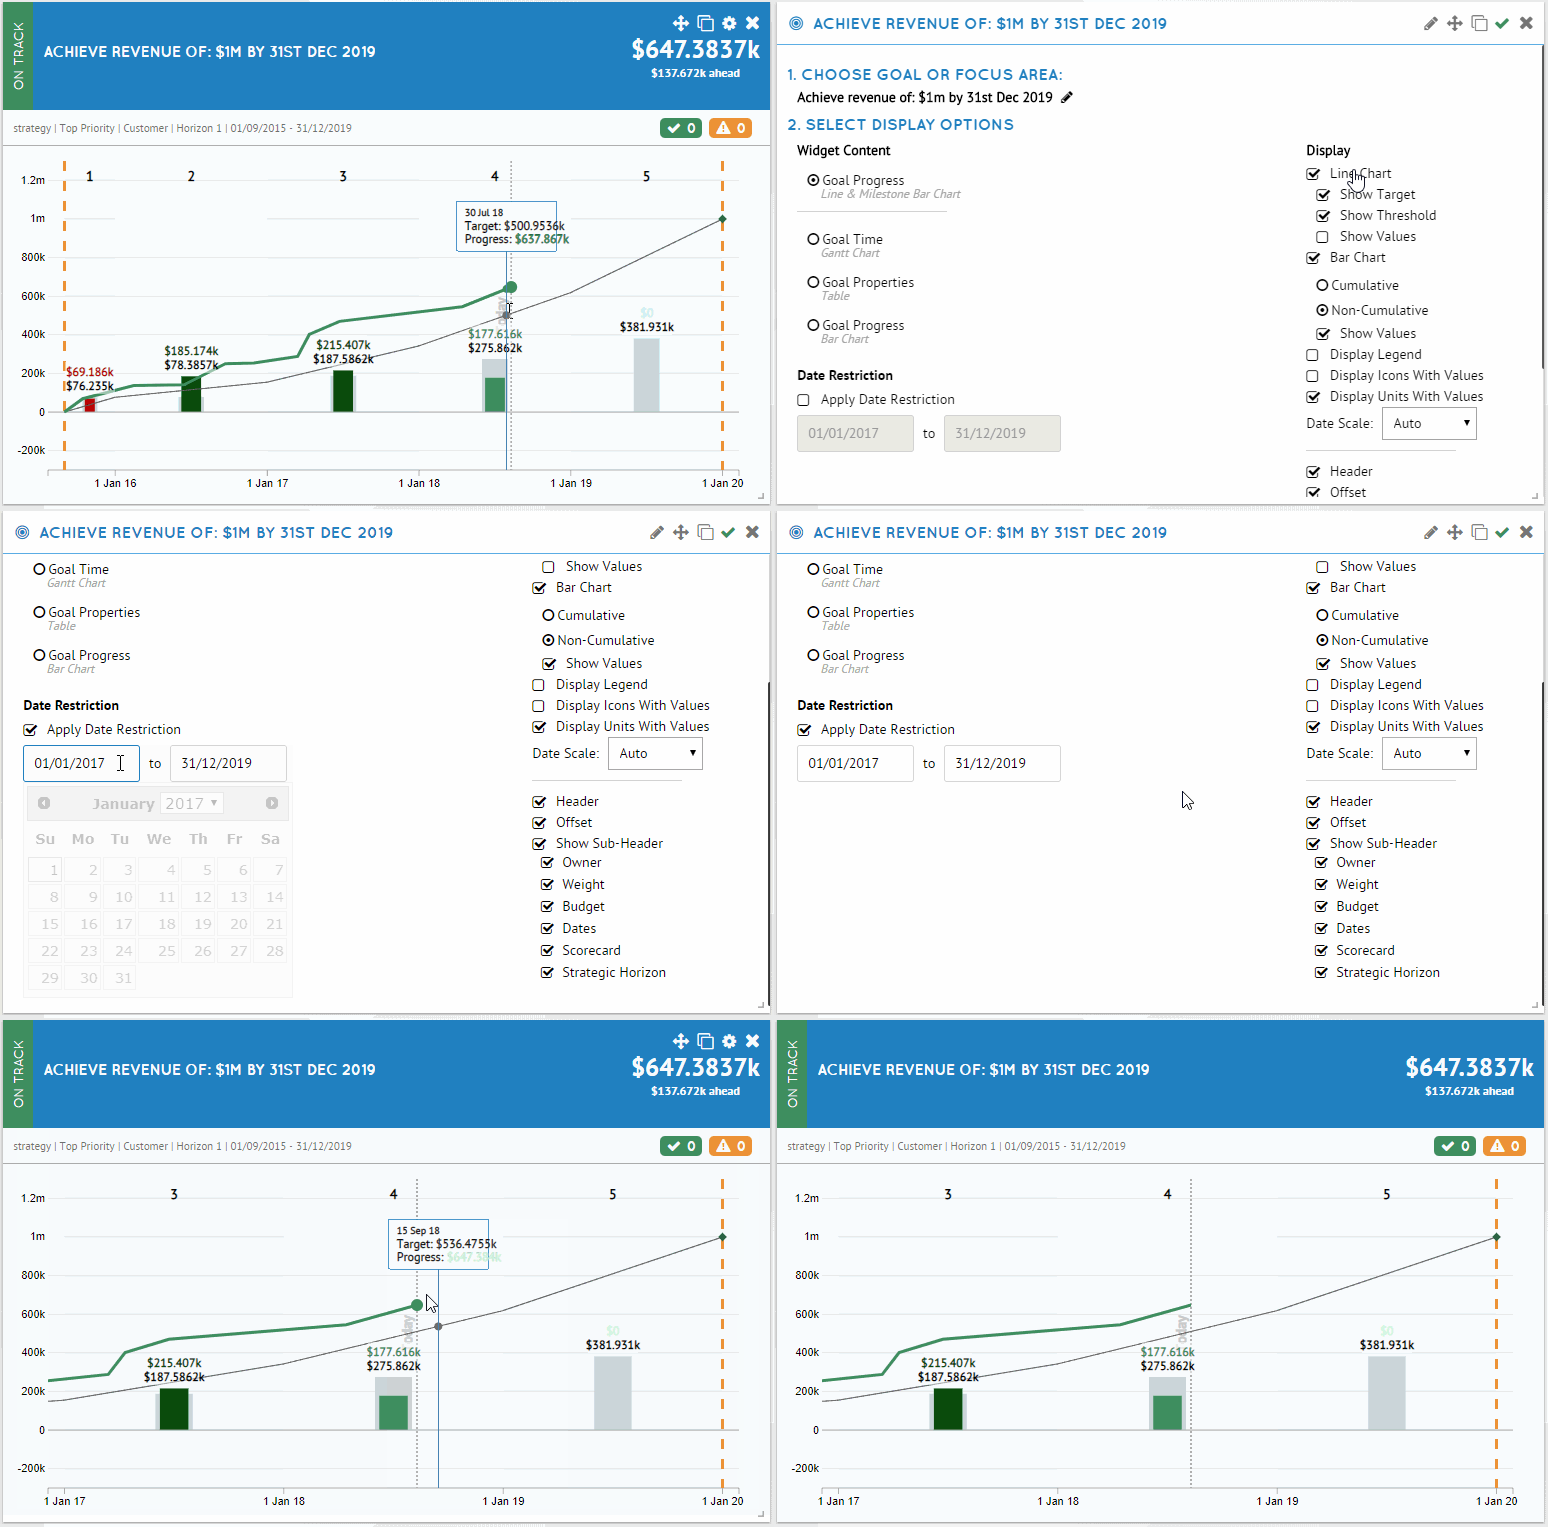
View progress for specific periods
For dashboard Goals widget, we have added an option to define line graph date range so that you can see goal progress made on specific date range. For example, for my revenue goal below, I can define the date range on goal progress line graph by click on the cog wheel icon and tick option 'Apply Date Restriction' to show revenue progress after 2017 only.
.png?width=200&height=80&name=Classic%20Experience%20(1).png)
