.png?width=200&height=80&name=Classic%20Experience%20(1).png)
Engaging People with Cascade
One of the main benefits of Cascade is that it helps your people engage with your strategy more than ever before. Once you’ve launched your strategic plan, you’ll want to track how well your organization is engaging with the new strategy and with Cascade as a platform.
One of the most useful features to help you do this is Cascade’s Engagement Report, found in the sidebar menu under Tracking> Engagement. You can also find tips on how to improve engagement here.
The Engagement Report
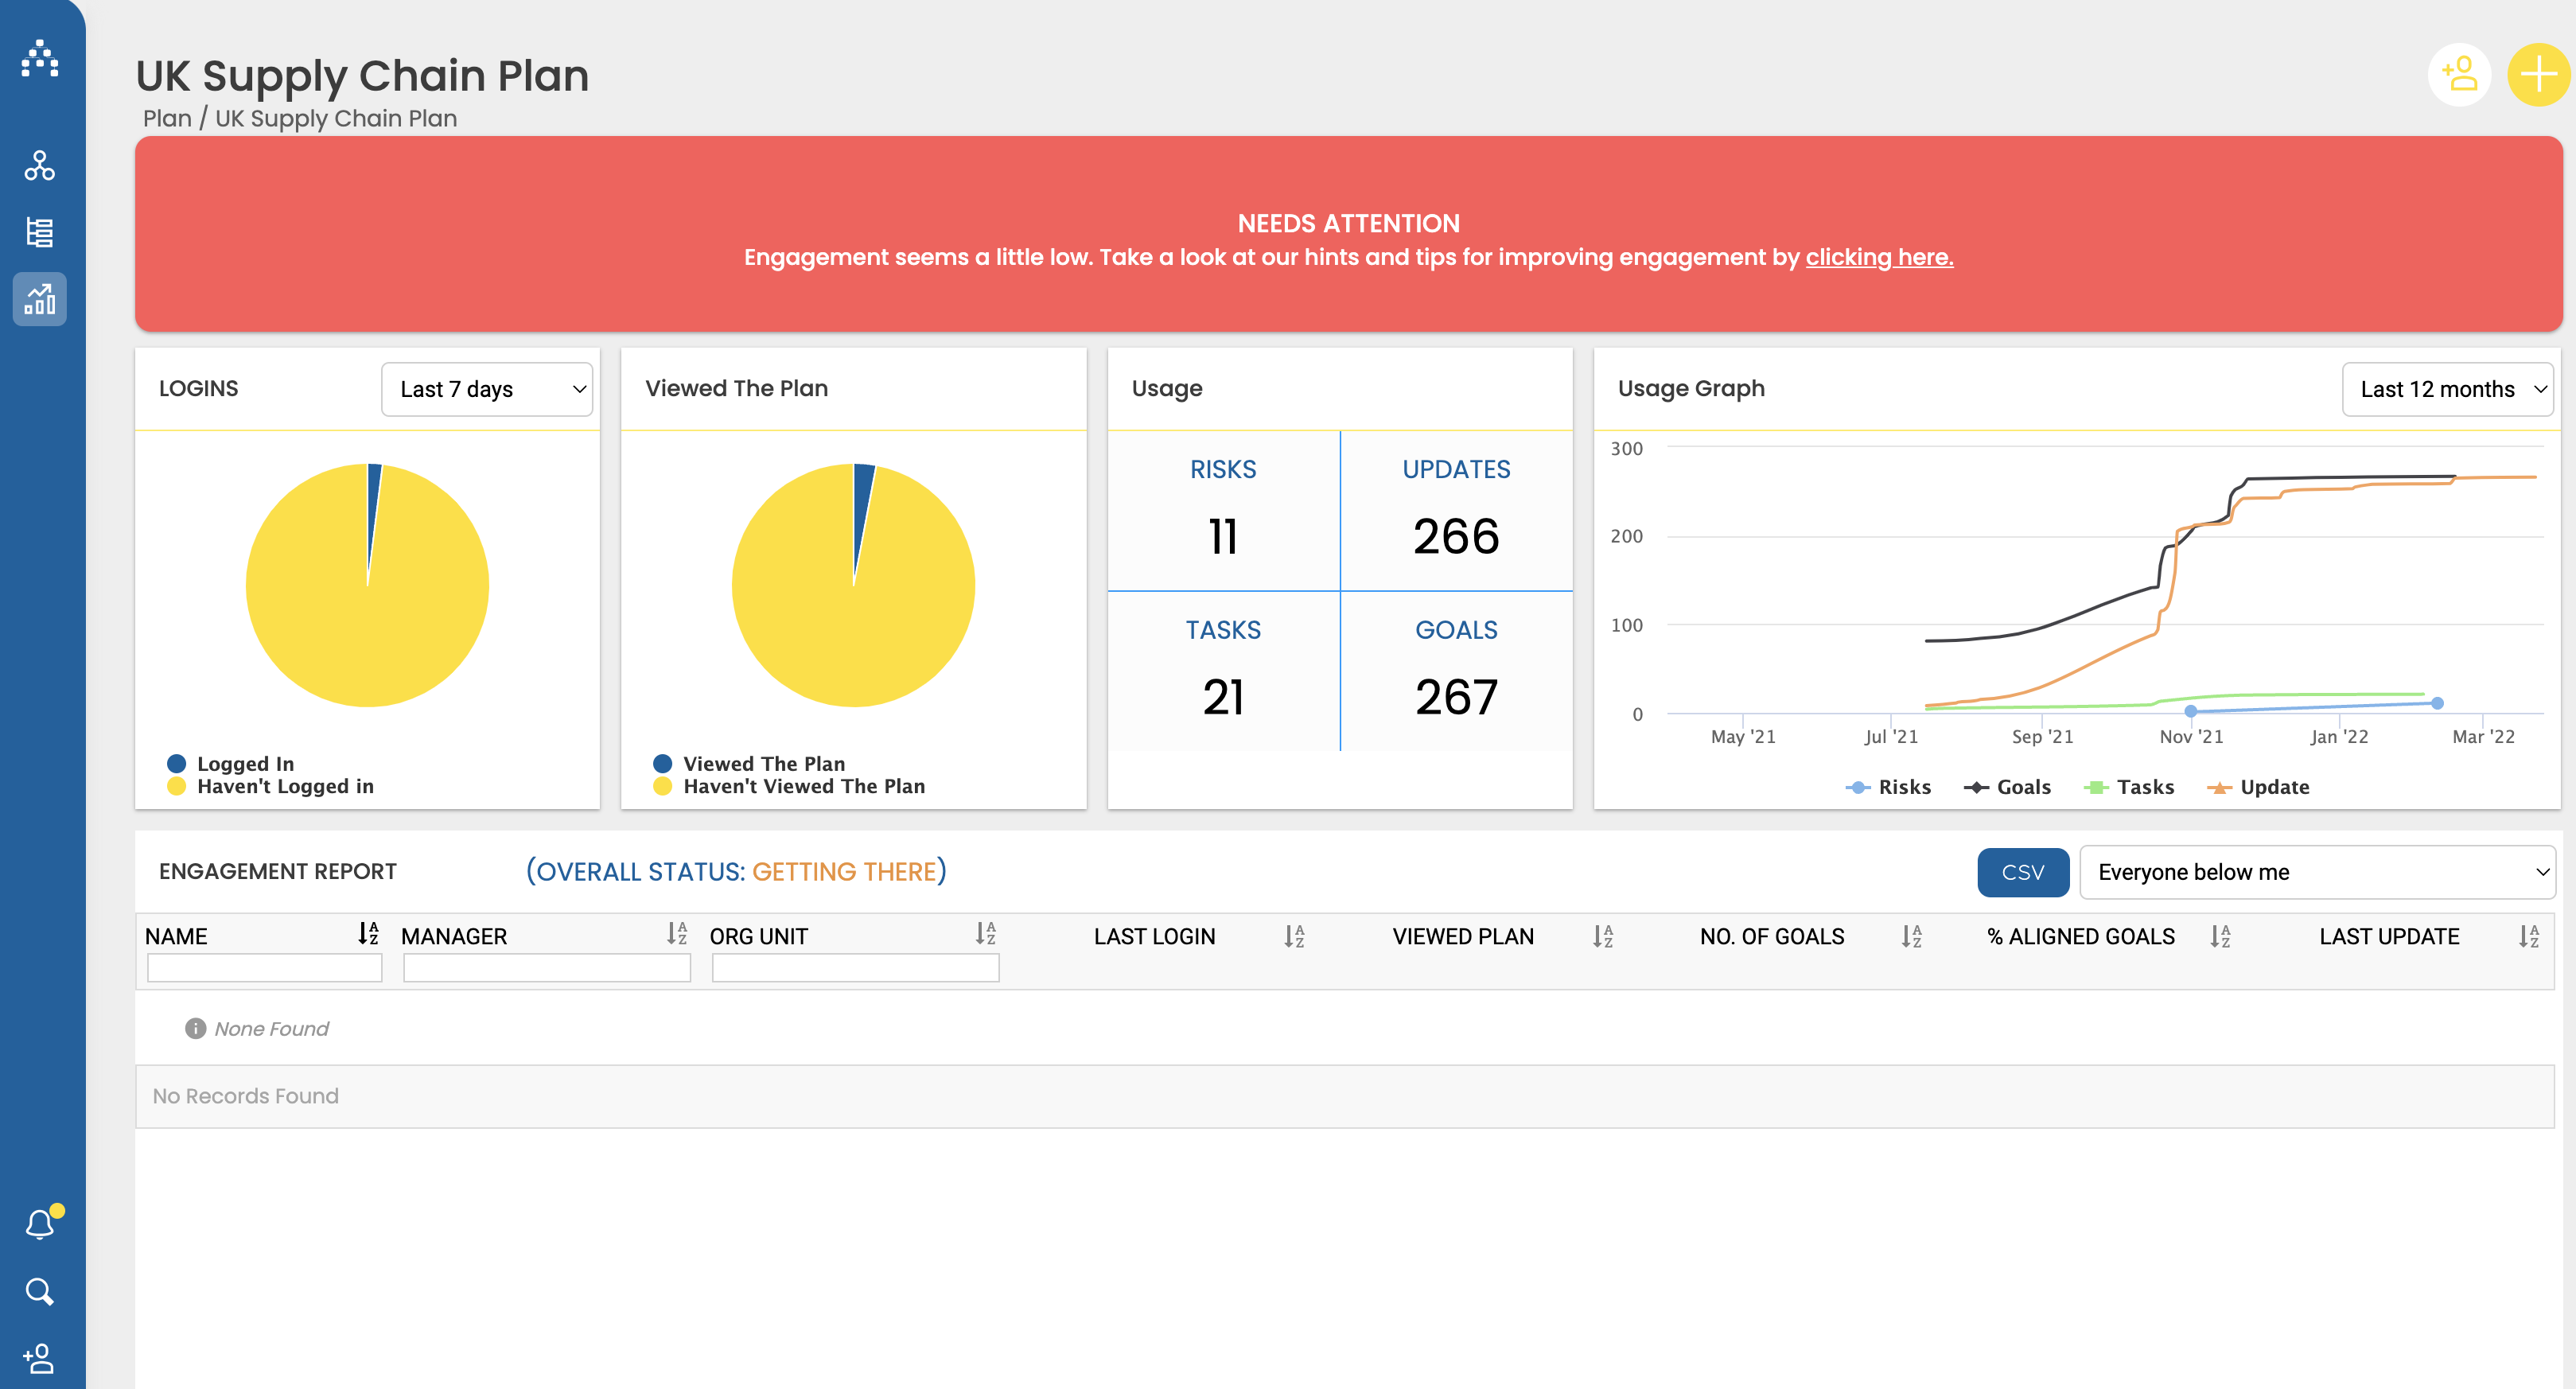
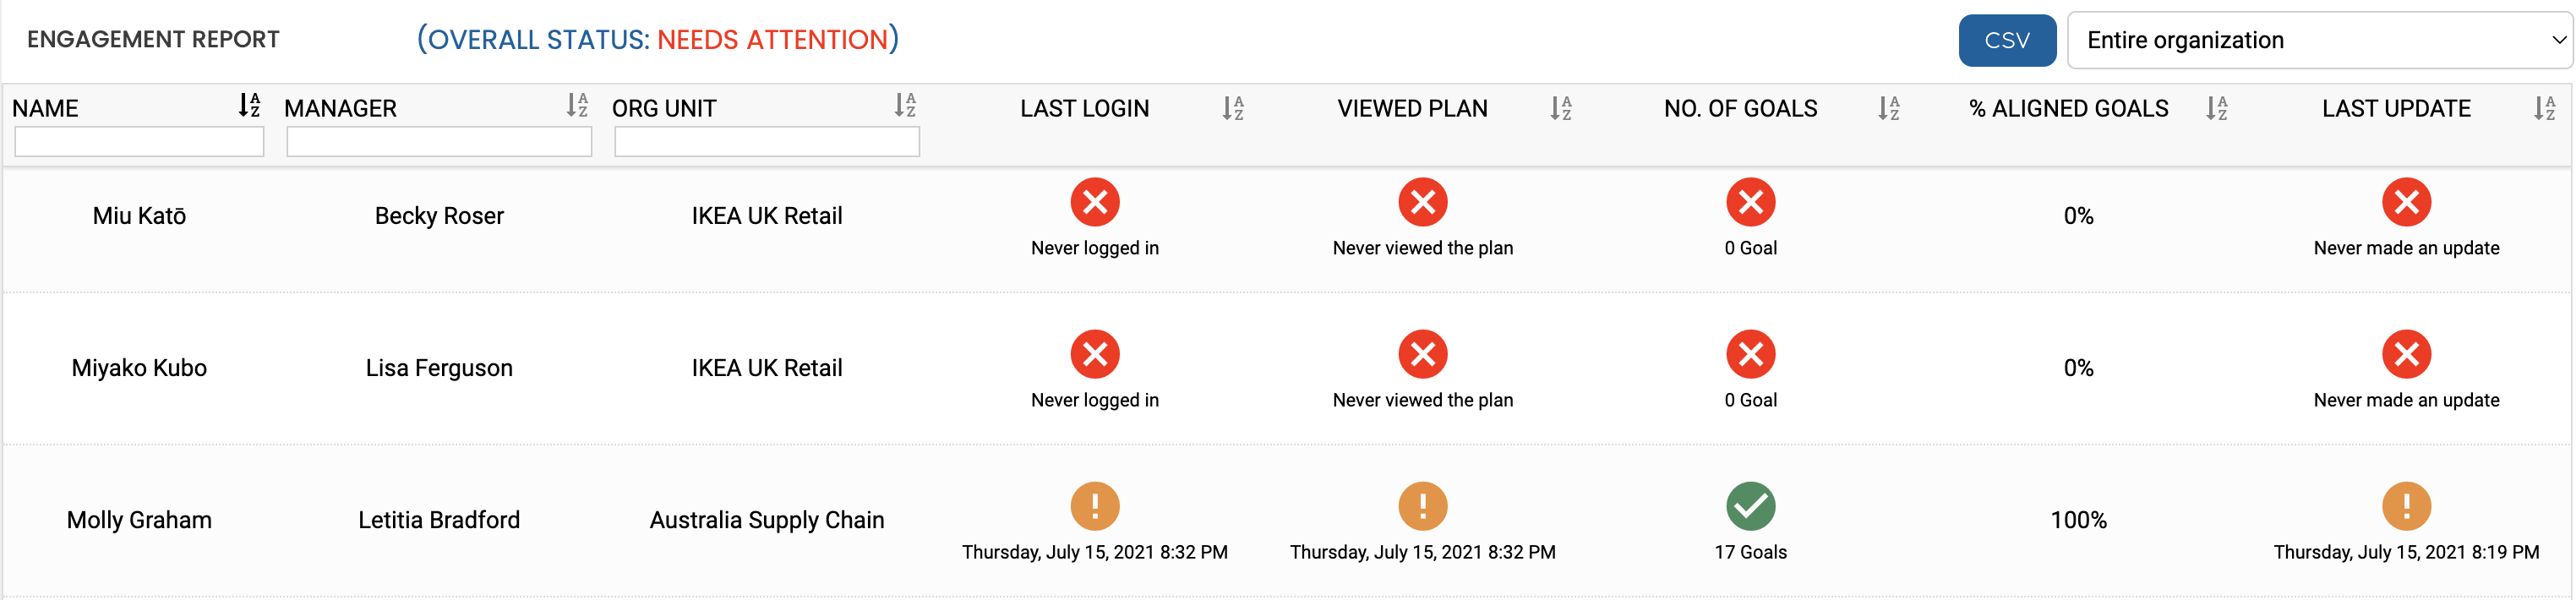
The Engagement report can be used to give you both high-level and detailed insights into how your people are engaging with your strategy and the Cascade platform.
The report uses a range of metrics to represent strategic engagement, including looking at user logins, whether they are taking the time to look at the strategic plan, and how often they perform critical activities in Cascade, such as updating their goals.
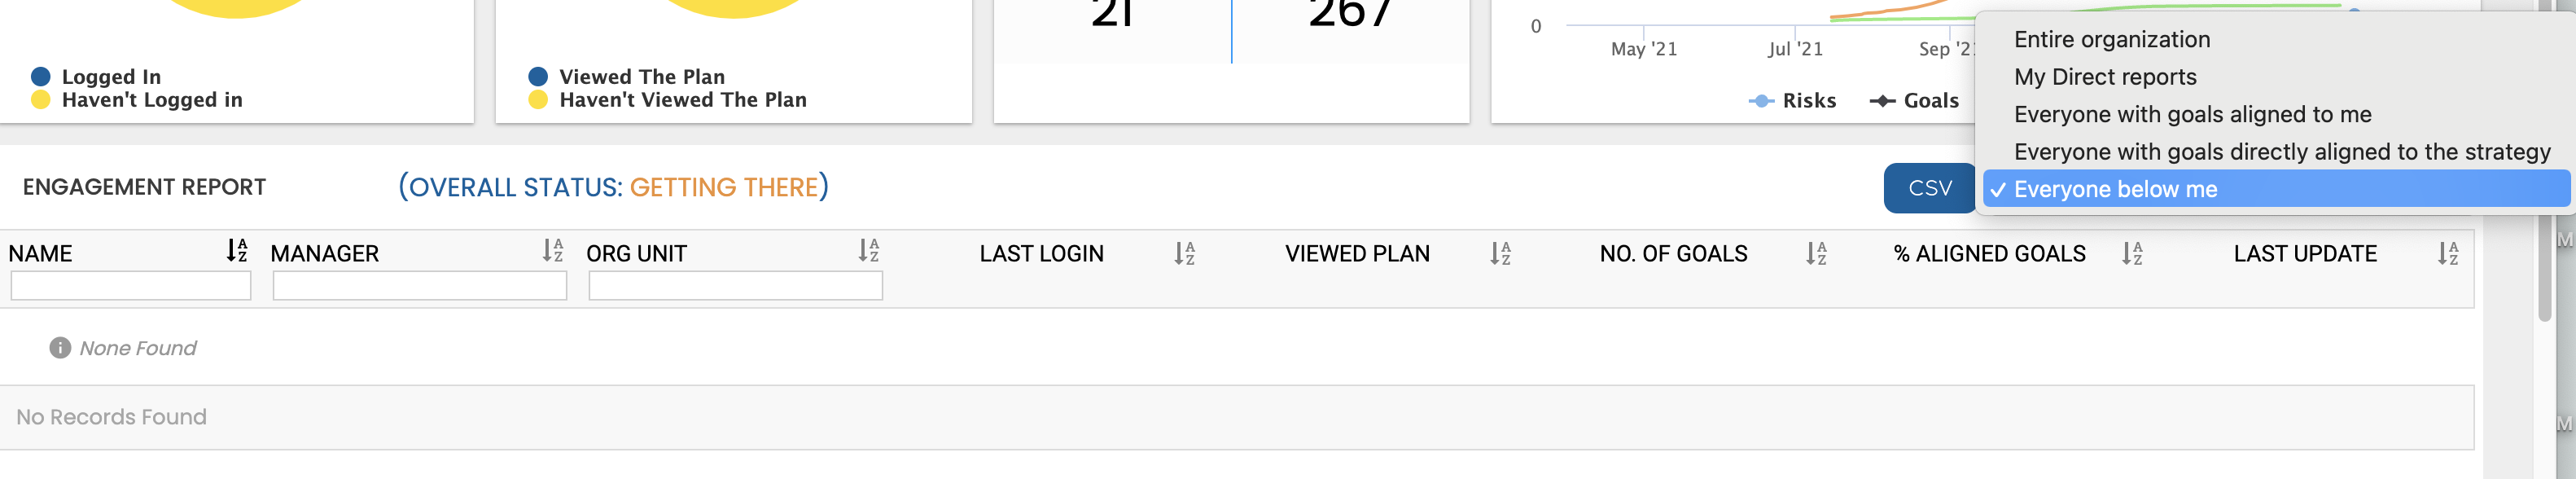
The Engagement report in Cascade gives you two different health indicators – one for your entire organization and also one for any selected filter you apply, such as ‘your direct reports’, ‘a particular business unit’, etc. (note that only admins can see this information for the entire organization at once):
The overall health indicators are as follows:
-
Needs Attention: The engagement of your people with the strategy appears low, based on these indicators. You should consider taking action to persuade people to engage with the bigger plan for the organization.
-
Getting There: People are generally taking the time to engage with the strategy, but there are areas that need your attention to improve how people are interacting with the bigger picture.
-
Looking Good: The level of engagement in the organization is high.
The status is calculated by looking at:
-
How often your people are logging in
-
If they have viewed your strategic plan
-
Are they creating and then updating their goals
-
Are they having one to one meetings with their managers to review their progress
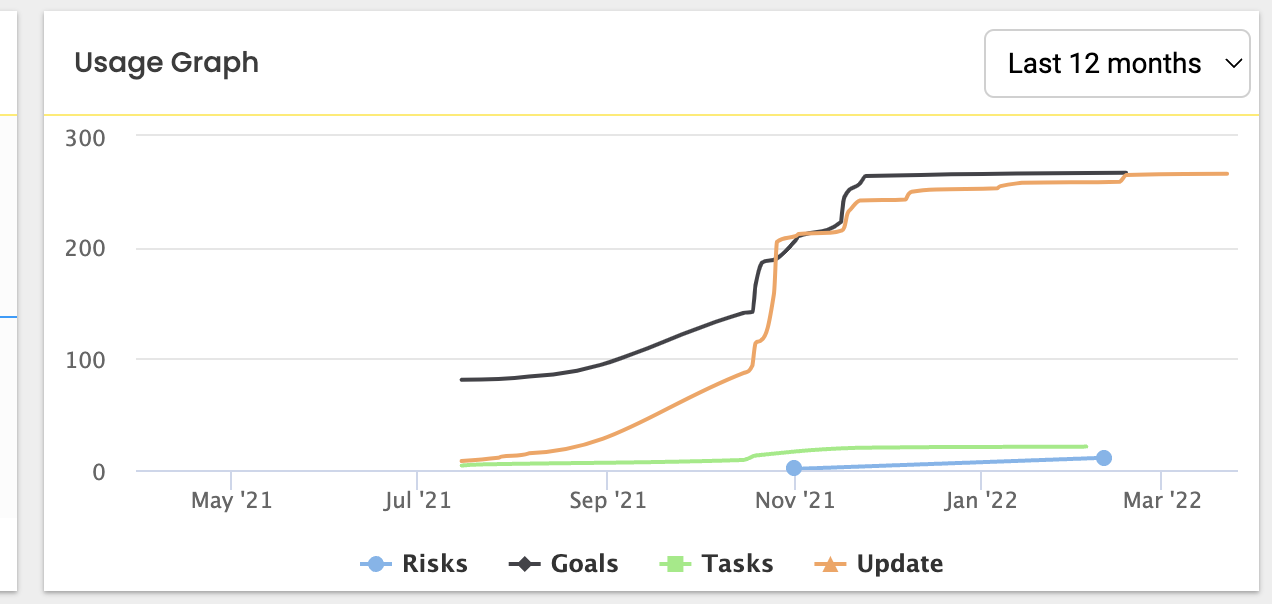
The usage graph indicates when issues, goals, tasks and updates are performed across your organization. This graph can be useful in highlighting your people’s usage habits over time.
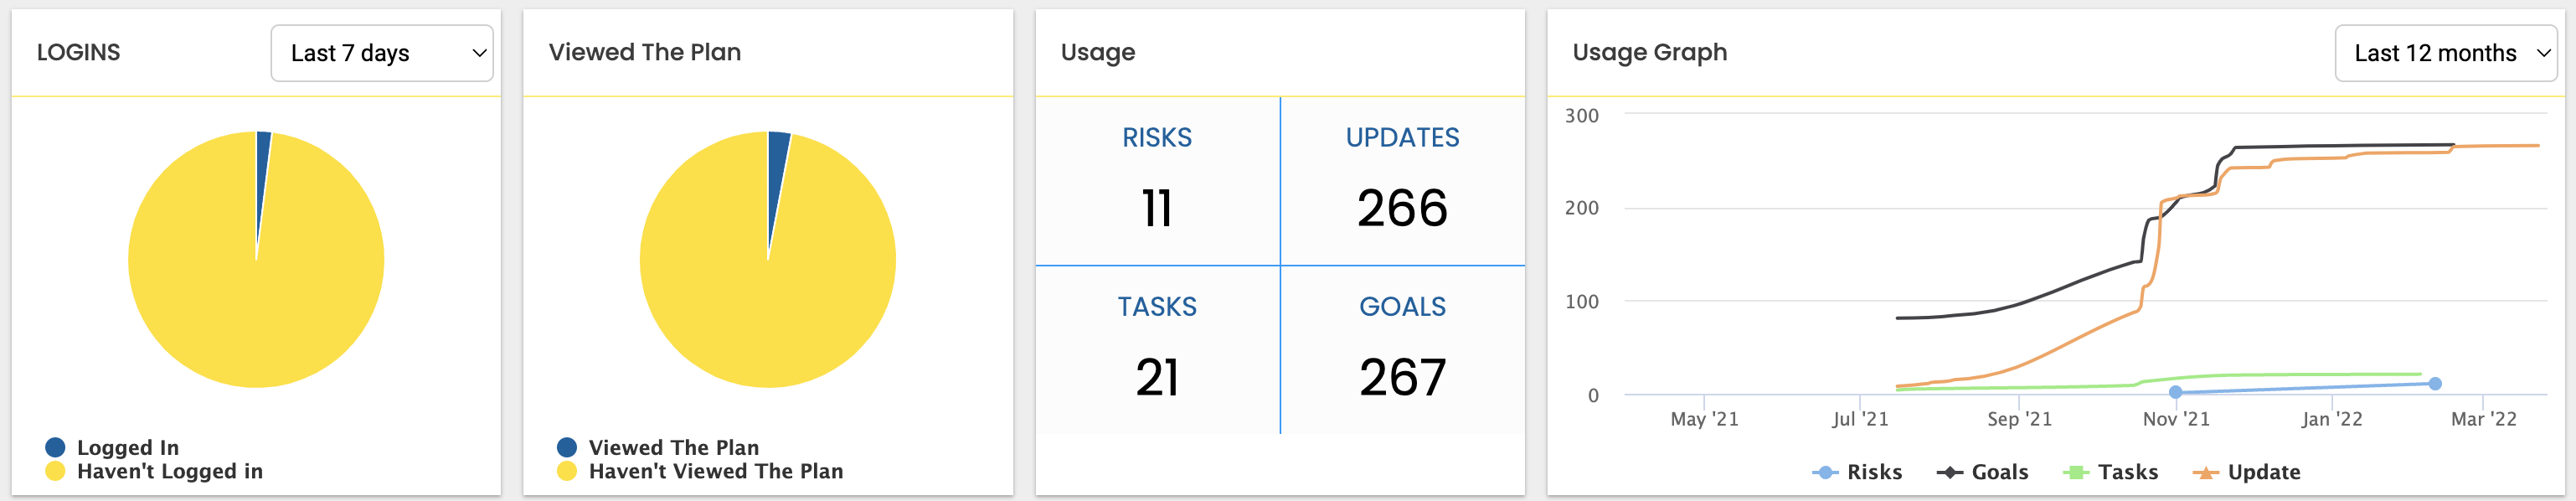
Examples of Usage Graphs
The ‘Goals’, ‘Updates’ and ‘Tasks’ lines are all growing at a similar pace. The fact that they are growing indicates that people are engaging more and more with Cascade. The fact that they are growing along similar lines indicates that people are using all the key features of Cascade to not just create their goals, but to manage and report on them too. Having a low ‘Issues’ line can either indicate only a small amount of issues being raised or alternately that its feature is not being fully utilized.
Another example could show that new goals are being added to Cascade, but people don’t seem to be using Cascade’s features to manage and update those goals. This could indicate a lack of engagement with the execution aspect of the this organization’s strategic plan.
Individual and Team Engagement
After looking at your high-level information you can zero-in on teams, business units, and even individuals. All information in the Engagement report can be searched, sorted and filtered. When you select a filter the Engagement Report will provide you with a health status for that specific data set. You can even export the displayed data to CSV for more in-depth analysis outside of Cascade as needed.
How to Improve Engagement
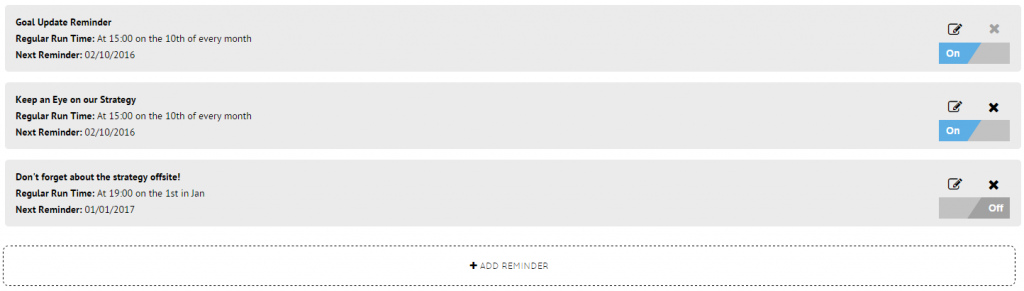
1) Use Reminders
Reminders are a great way to encourage people to engage with your plan. We have prepared a few reminders in your Cascade system already, but you can add as many more as you like. Reminders will trigger emails at certain times to have people login to the system and update their goals, read about changes to the strategy, etc...
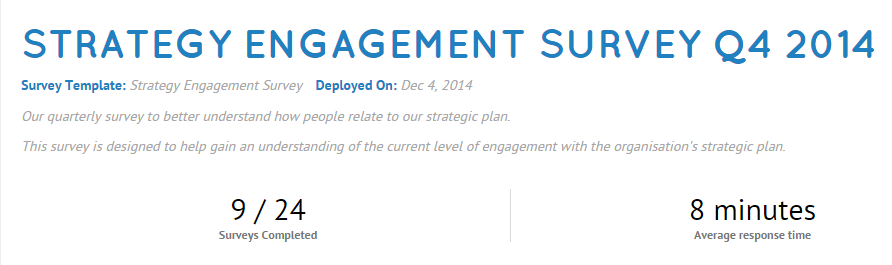
2) Launch regular internal surveys
Asking for your people’s feedback is a great way to drive engagement and connect them to the strategy. Launching surveys regularly helps give an incentive to login, update goals and share opinions. There are plenty of strong free survey tools out there, such as Google Forms.
3) Incorporate Cascade into existing activities
If you currently already run weekly team meetings or have 1:1 meetings – Cascade can be used to facilitate them. Snapshot reports can be used as an agenda for meetings and are perfect for gaining a sense of how your people are handing their deliverables within the strategy. Managers should encourage their direct reports to login and update Cascade just before the meeting, and then use Cascade as the ‘source of truth’ for the meeting itself.
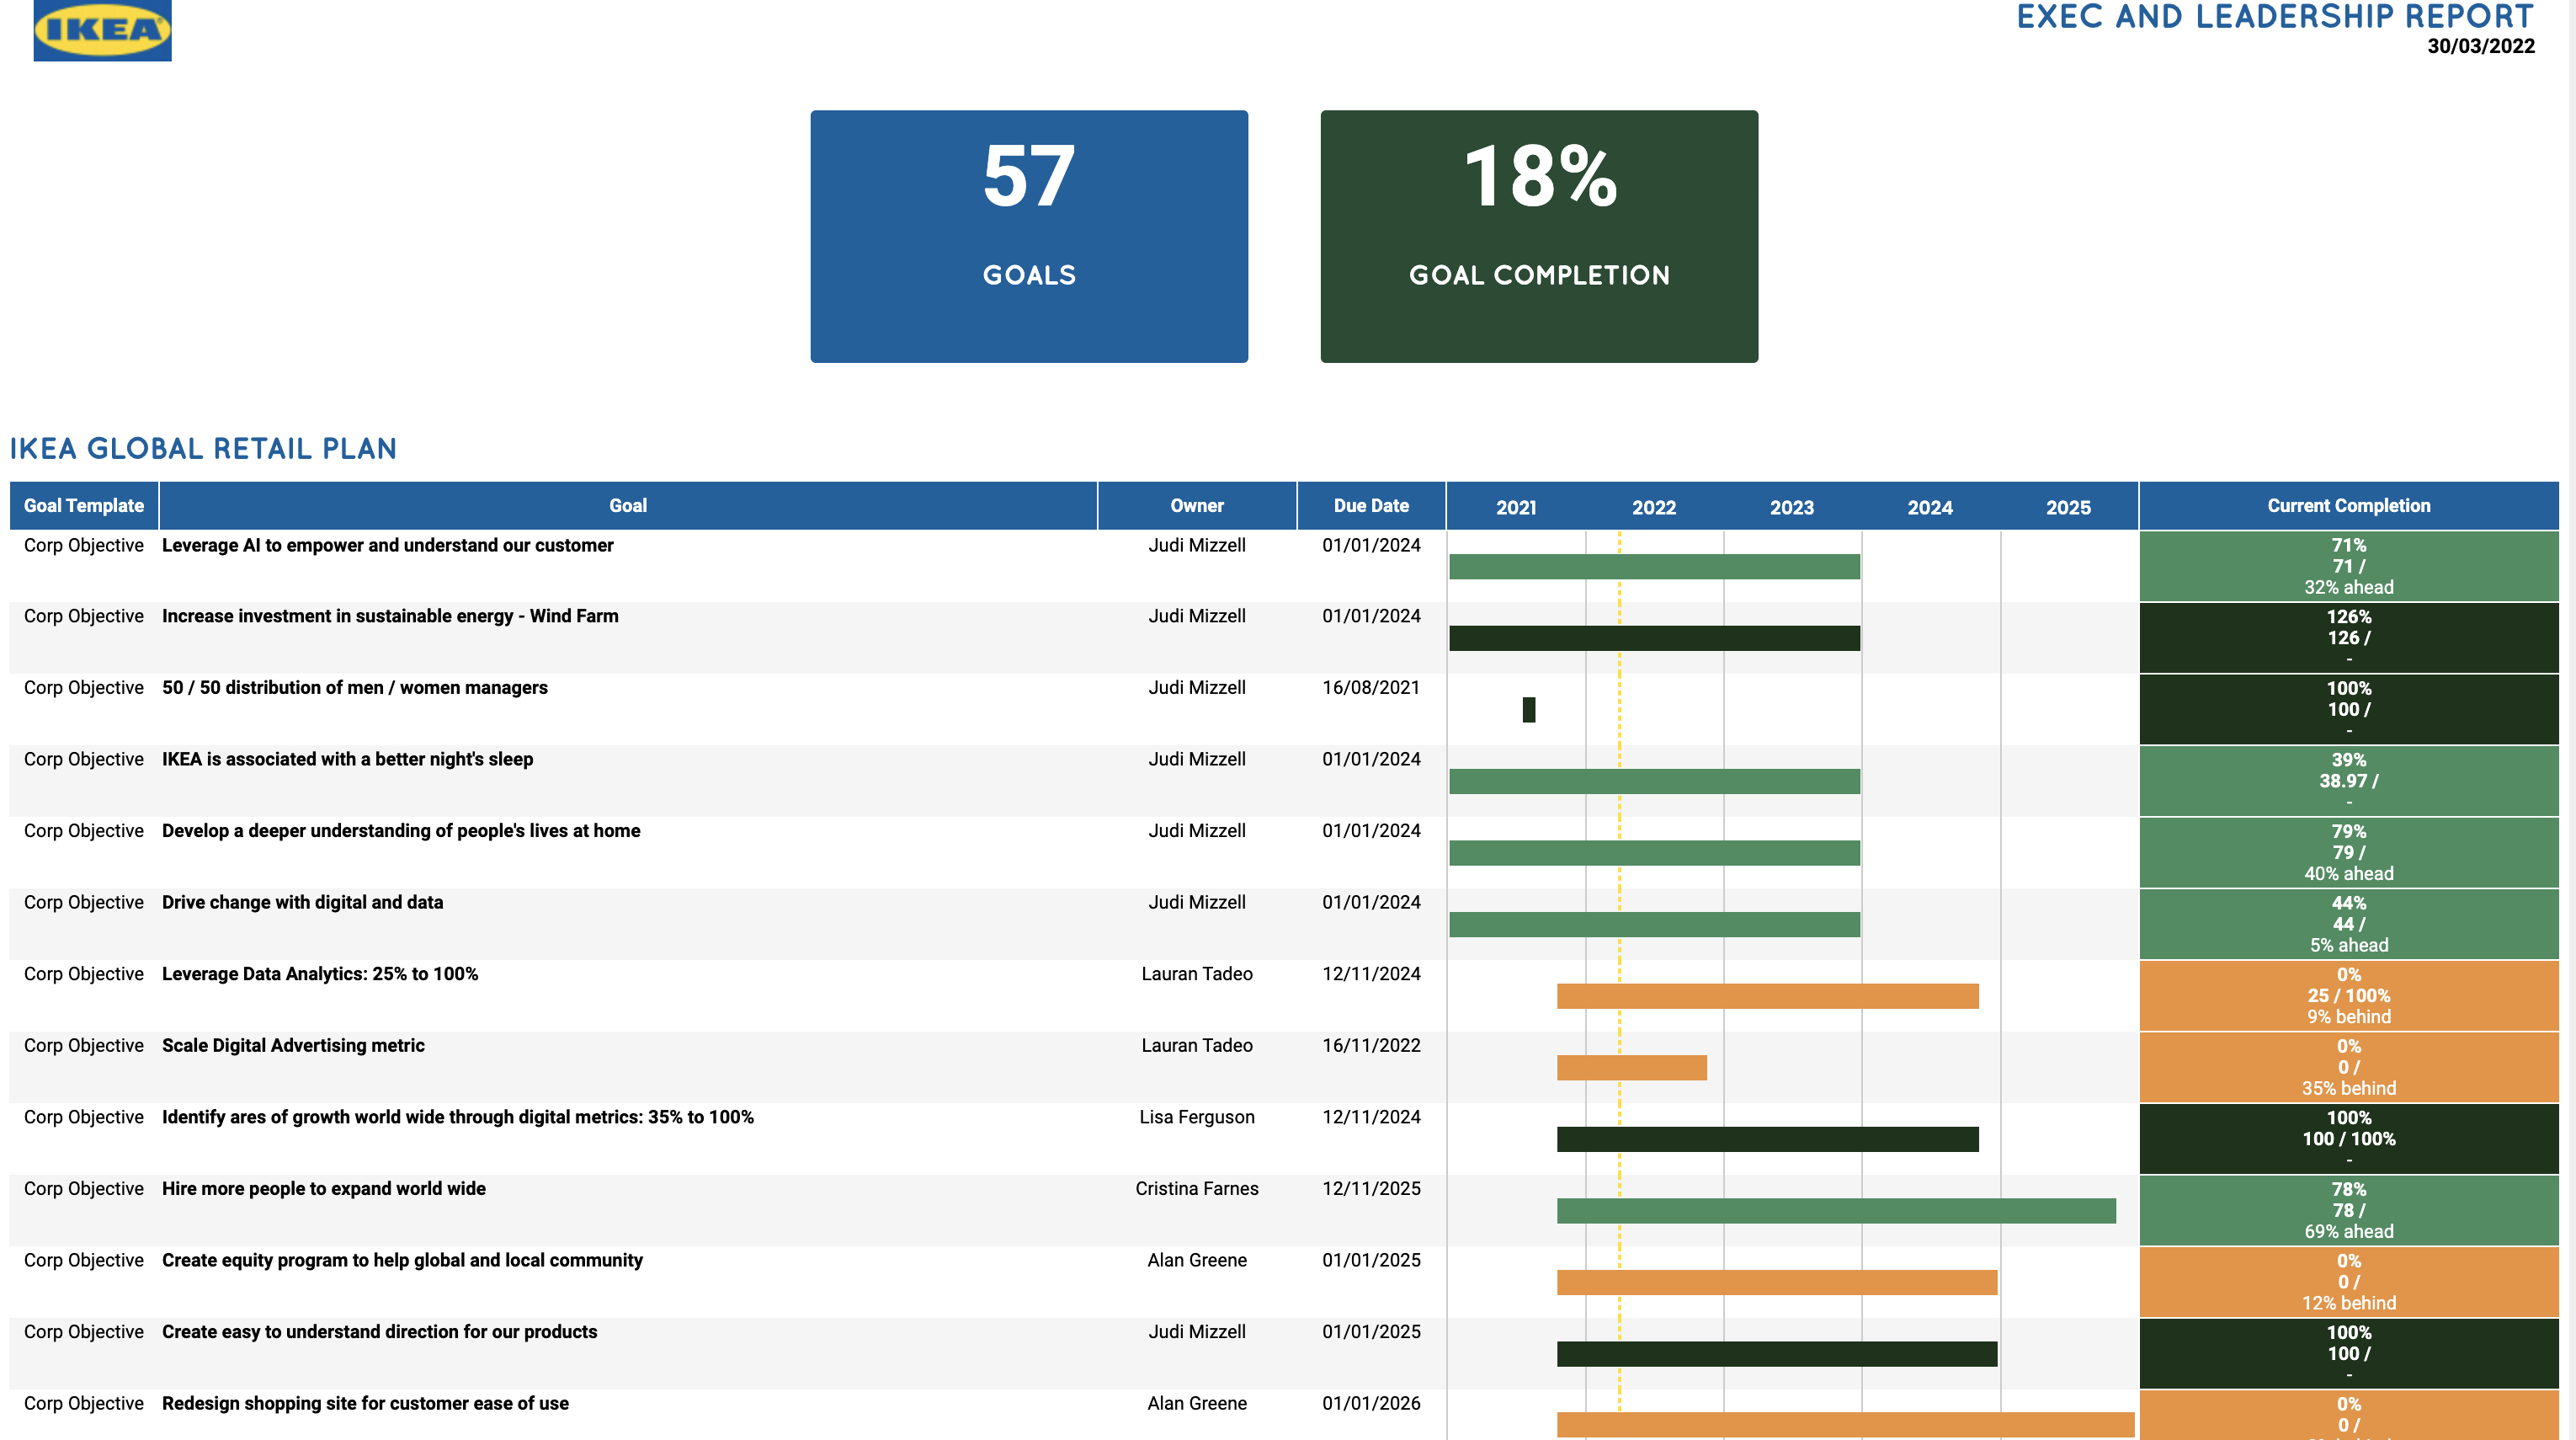
4) Setup some ‘shared’ dashboards
Dashboards are a powerful way to get instant access to your organization’s performance data. Checkout our guide to Dashboards right here and consider creating some shared dashboards so your people get see exactly how your strategy.
5) Implement Single Sign on
Do you use Active Directory? If so, we can integrate sign-ons with Cascade to make it even easier for your people to access the platform. Send us an email at support@executestrategy.net to get started.
FAQs
How does Cascade calculate ‘Engagement’?
We use a proprietary formula to benchmark engagement, which takes into account a mixture of elements such as:
-
When a user last logged in
-
How often they view the strategic plan
-
How much time they spend viewing the plan
-
How often they update their goals
-
How many 1:1 meetings are recorded
-
How many goals they have
-
How aligned their goals are to the strategy
The formula returns an engagement score which is displayed on the engagement report.
Can everyone see the data on the Engagement report?
Only users with the ‘strategy’ permission will be able to see the full Engagement report. Other users will only be able to see the high level engagement data, but will not be able to see user-by-user engagement detail. If the user has staff directly reporting to them, they will be able to see the user-by-user data for their staff.