.png?width=200&height=80&name=Classic%20Experience%20(1).png)
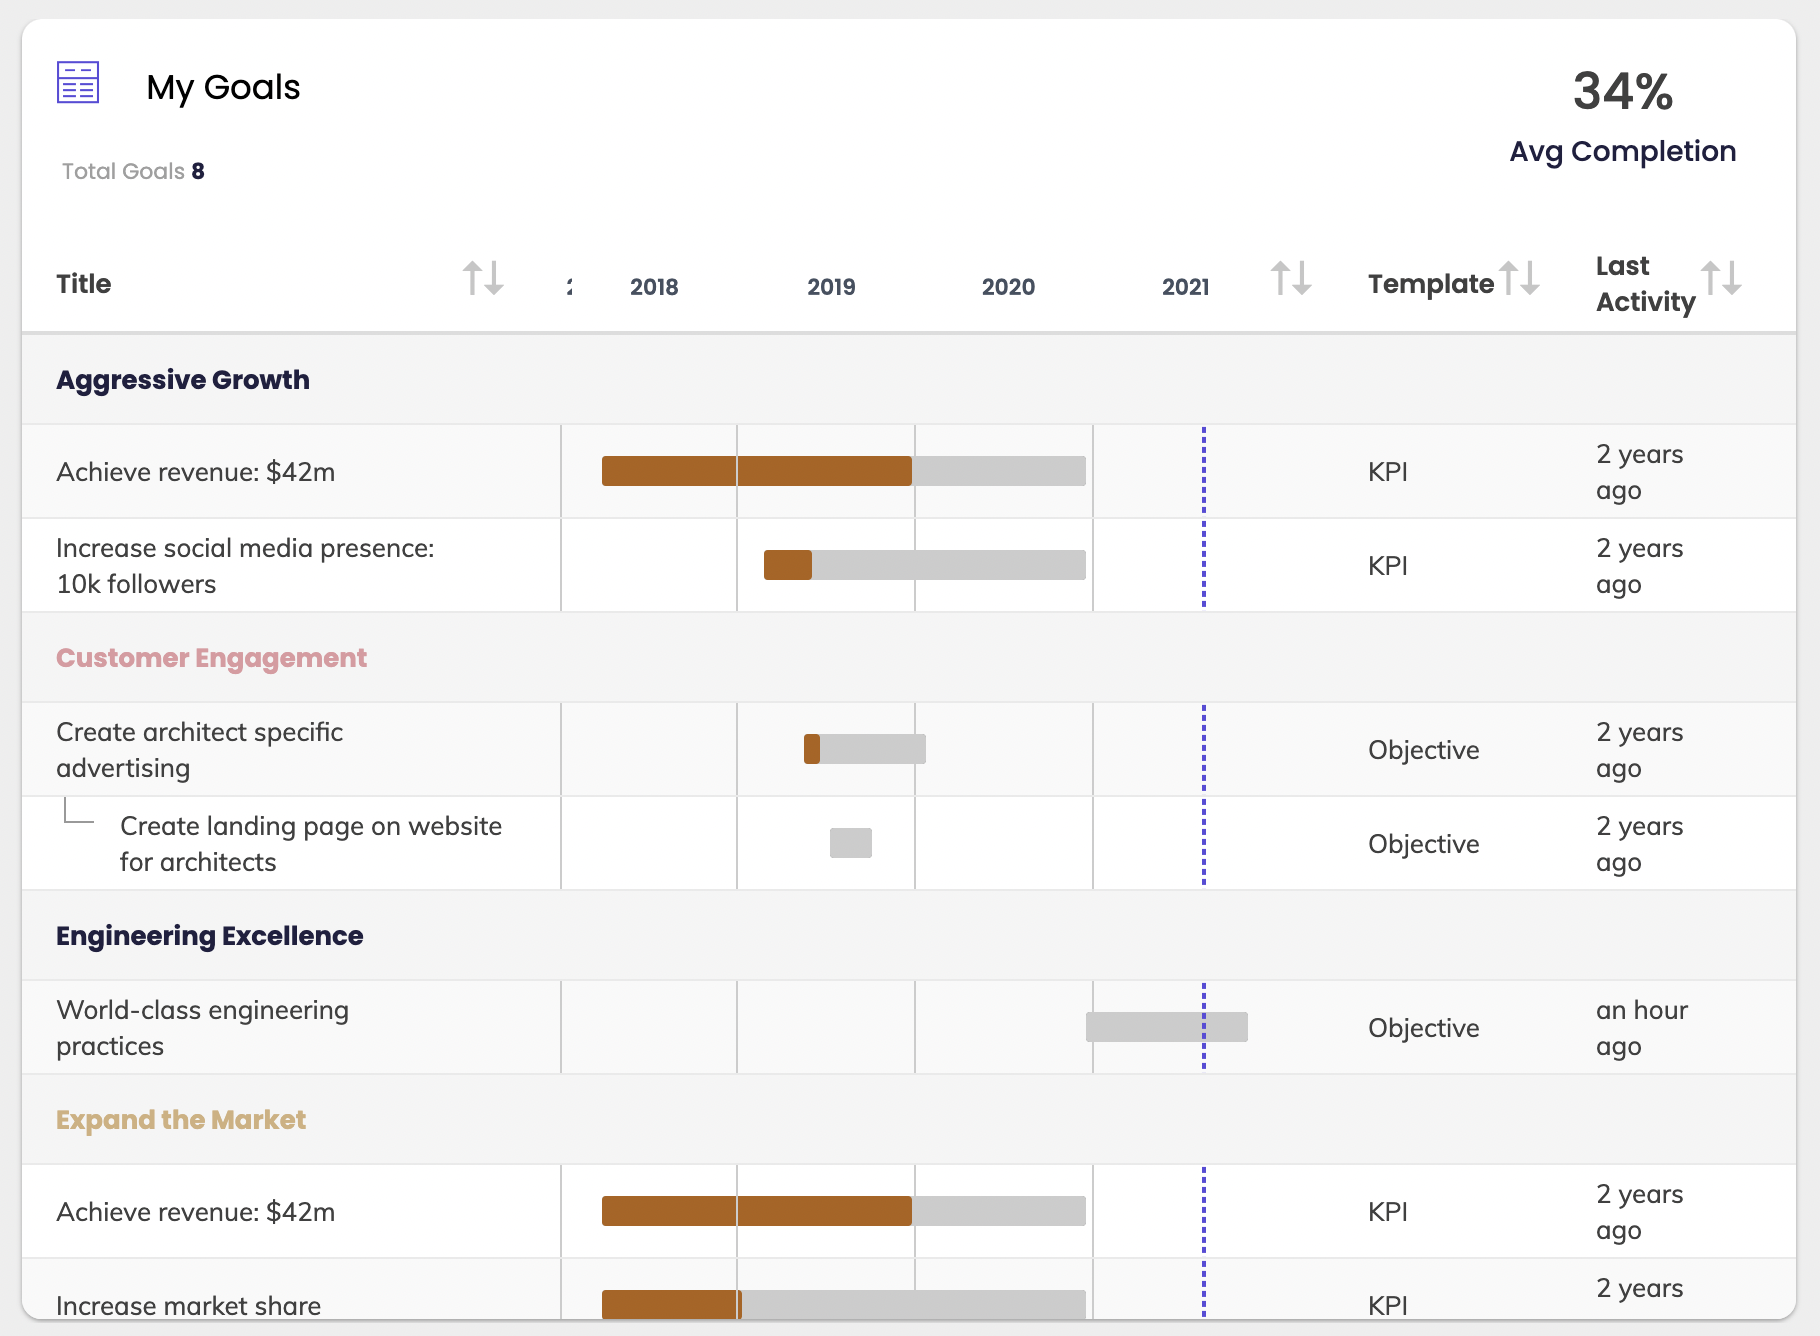
The Table Widget is a powerful tool to you in your dashboard because it allows you to display and filter most information in Cascade. The Table Widget is the most commonly-used widget for beginners in the system.
To add a Table Widget:
-
Click “add Widget”
-
Select the table widget first. Whenever you add a widget, what you’ll see first is the setting. The settings allow you to add filters that you can use to configure your widget.
-
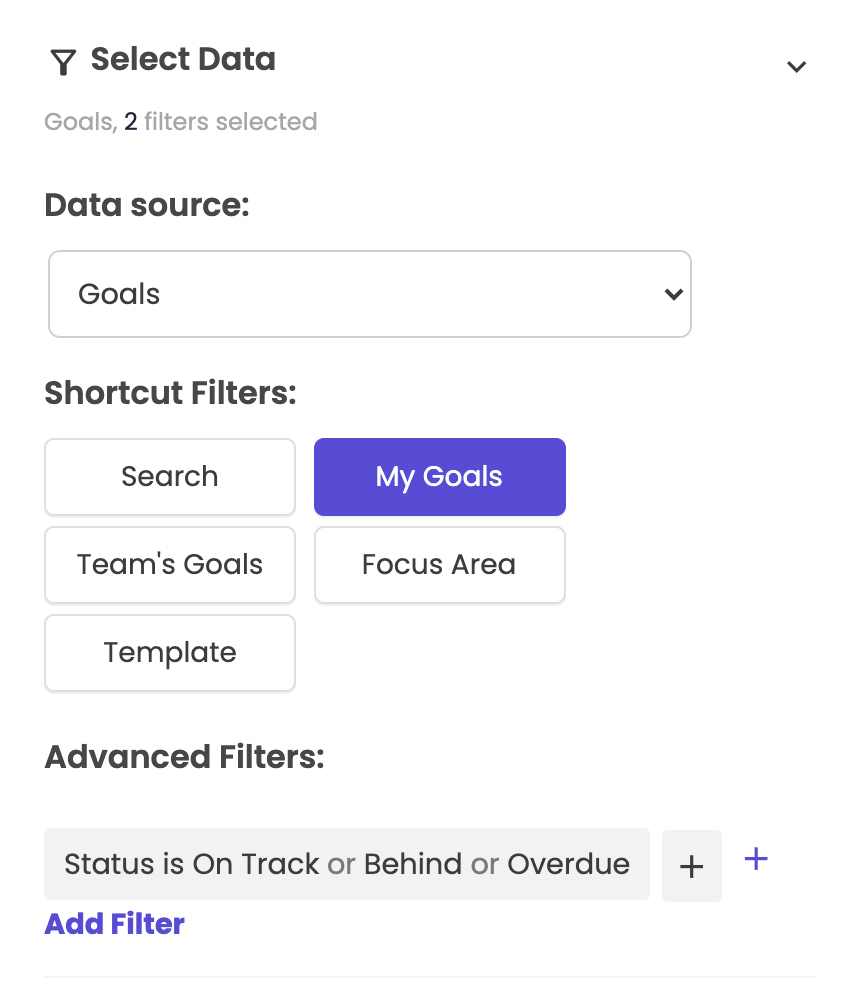
The default settings of the table widget is to filter by all the items that you own. To remove this auto-filter, click on "My Goals" which should be highlighted, press "clear."
-
Choose your filters. For more details on using filters in Cascade, visit the snapshots article.
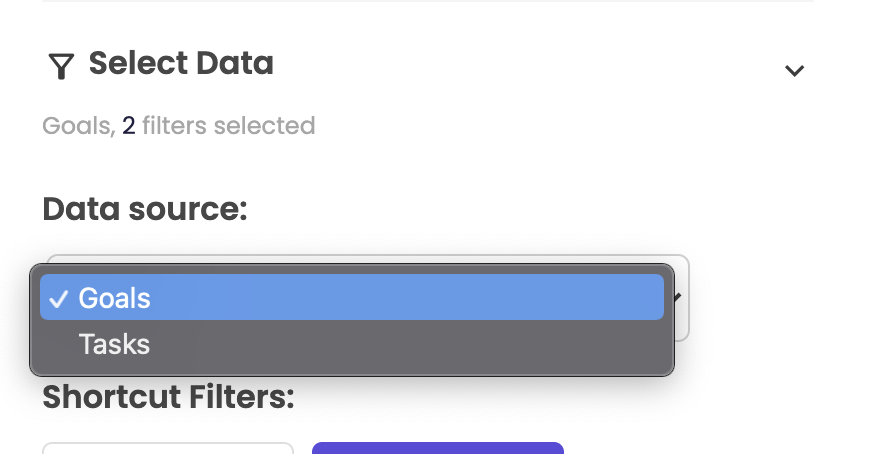
Remember, the Table Widget can be used for Goal or Tasks:
The Table Widget has a number of filters available (not all listed here):
-
Shortcut Filters: These are the most popular filters, so we put them on top.
-
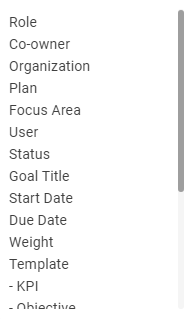
Advanced Filters - This is where you can filter on just about anything else in the system, using a combination of "And" and "Or" logic as needed. See the screenshot below for some examples of information available to filter on:
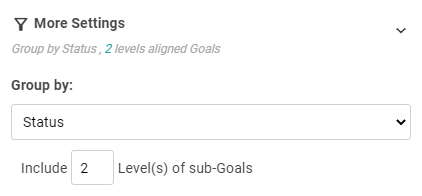
Under "More Settings" you can group the data by Due Date, Focus Area, Department, etc...and for Goals, you can decide how many levels of sub-Goals you want to display:
Once the configurations are complete, click Save. To display more information, click the column icon on the top right and add the columns you'd like to display (such as Target, Progress, Ahead/Behind Value, and Weight).
A detailed video showing how to set up a Table Widget is found below (somewhat old, but still useful):