.png?width=200&height=80&name=Classic%20Experience%20(1).png)
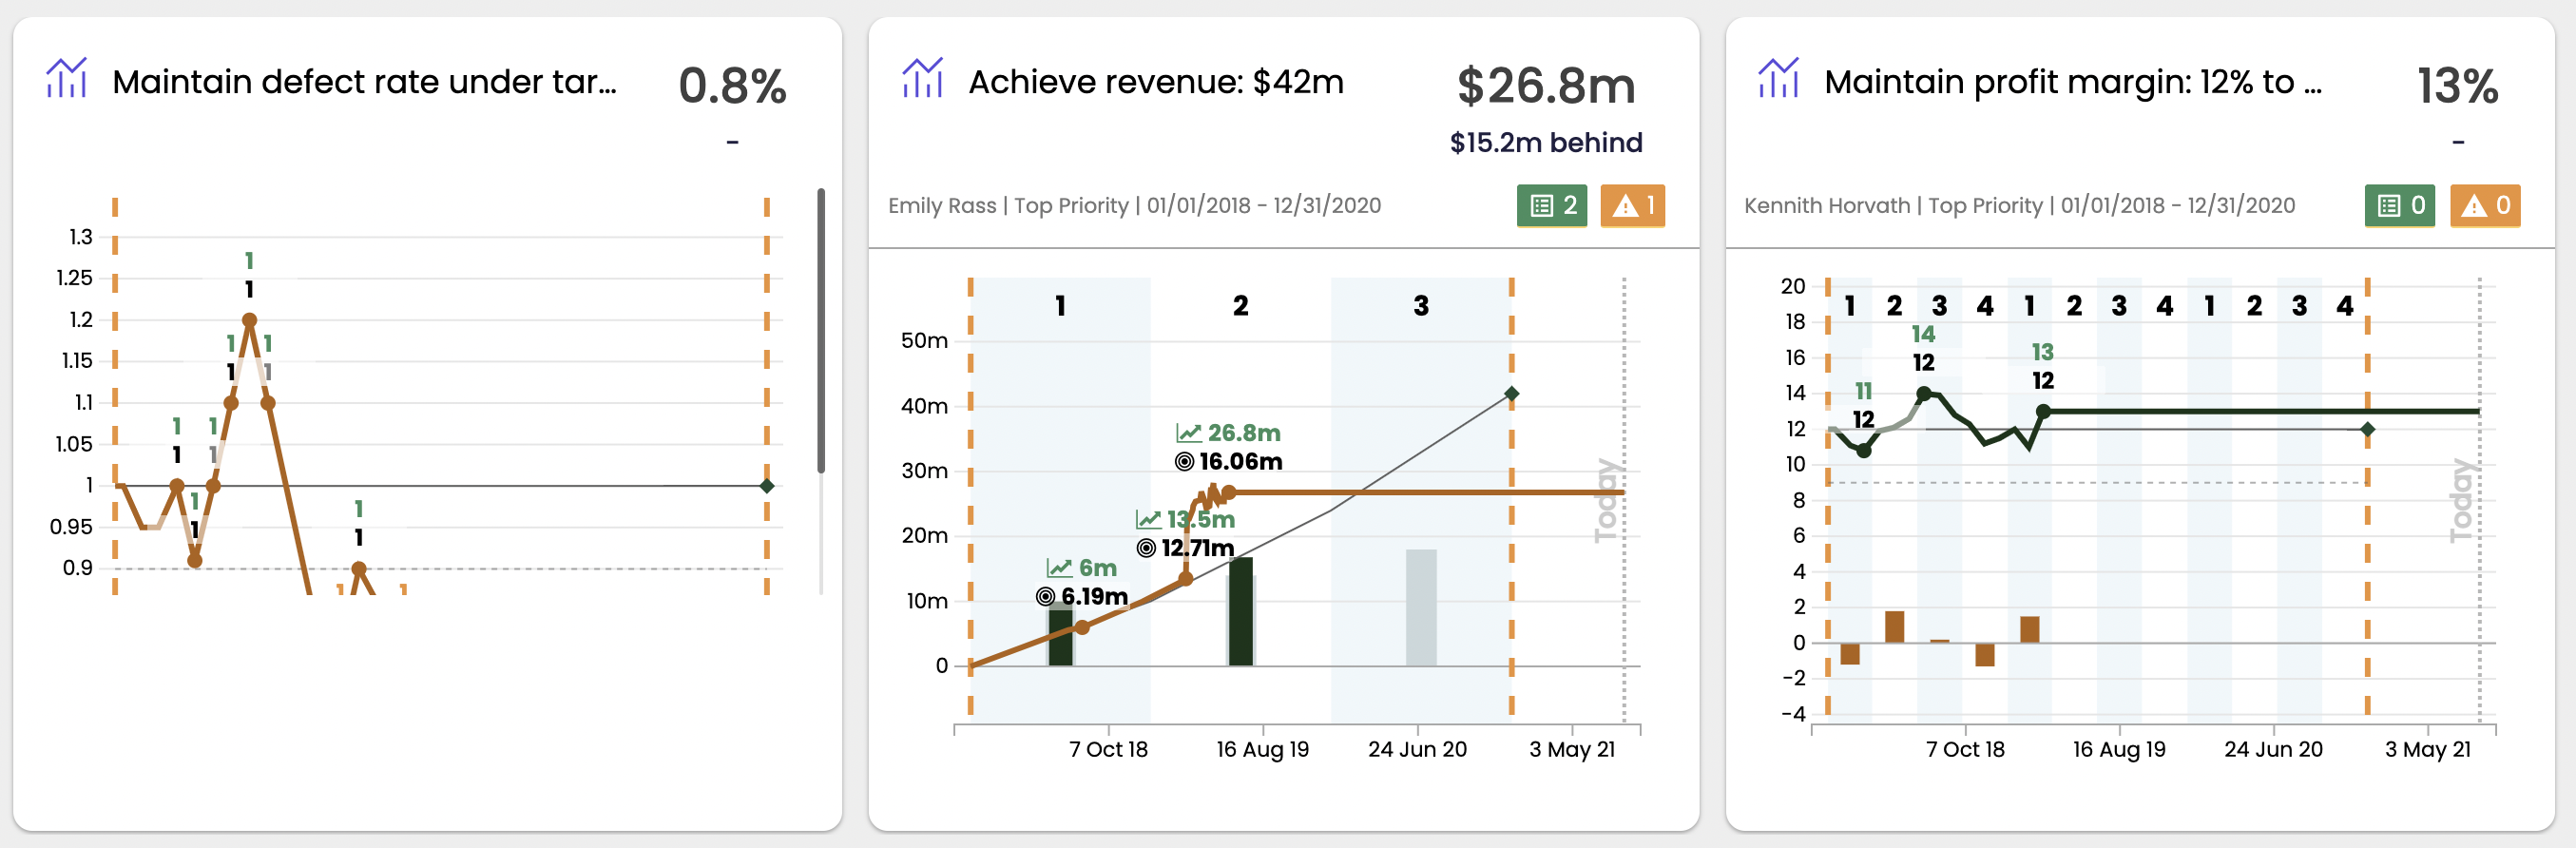
This, along with the table widget is the most commonly used type of widget in Cascade. With the goal widget, you can select a specific goal and any aligned goals and show the progress with a line graph, bar chart, gantt chart, or table. The KPI's shown below were comprised entirely out of this widget.
To add a Goals Widget:
-
First click "Add widget."
-
Choose the "Goals widget" and search for a goal.
-
Then, decide if you want to display all aligned goals, or only the overarching goal that you chose.
-
Then choose how you'd like to display your content. Options are listed below:
-
Line graph or Bar Chart over time
Line Graph
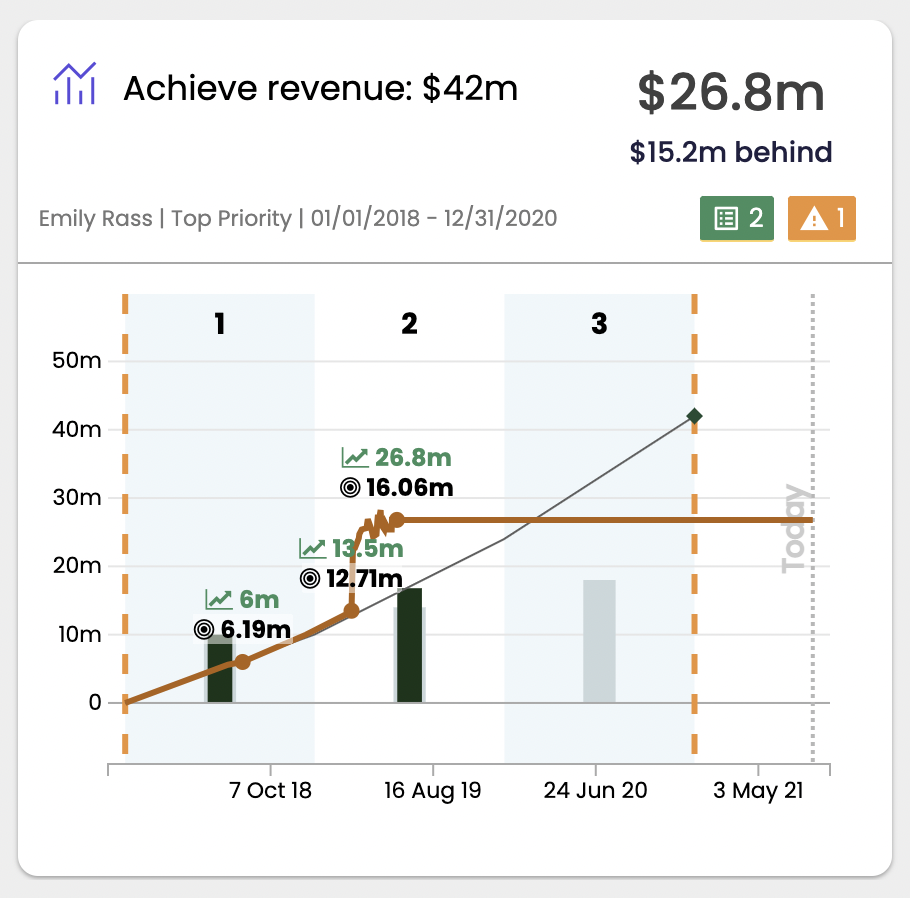
You can chose to display the target and threshold (if you've set a universal tolerance) directly on the widget. If you tick these off, we recommend turning on the "Display legend" tick-box as it makes things very clear for anyone viewing the widget.
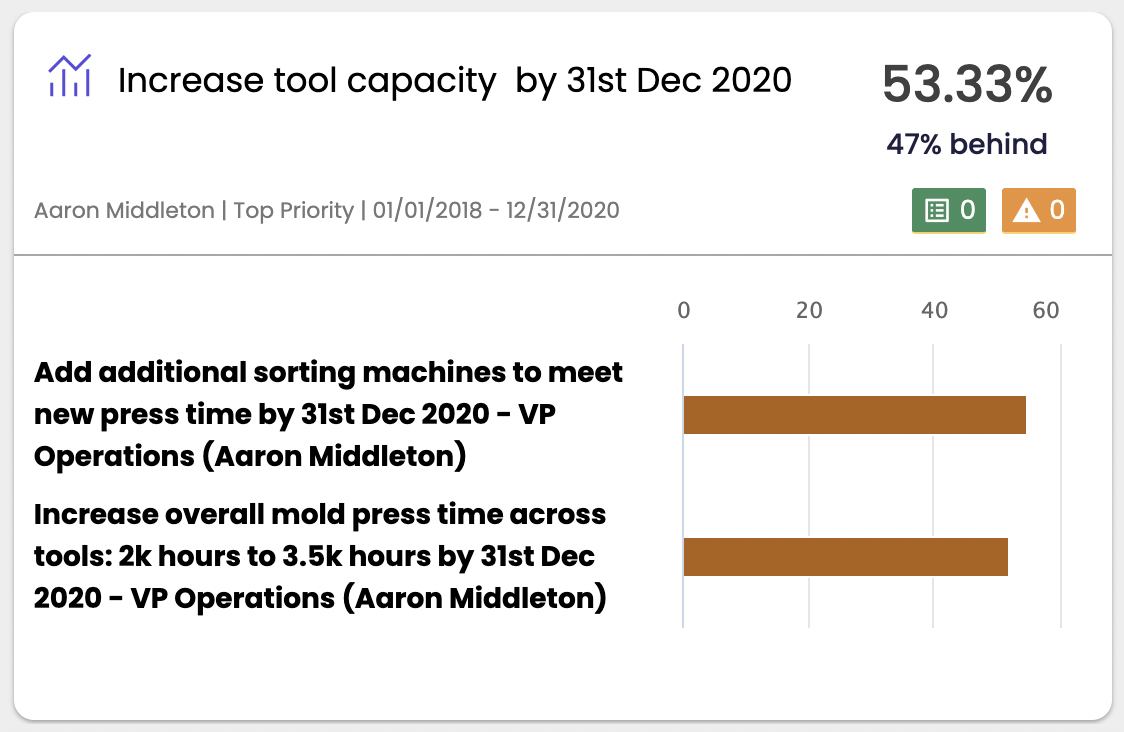
Bar chart
If you want to view your information in bar chart form, un-check the line chart, click the bar chart, and chose whether you want the information to be displayed cumulatively or non cumulatively. This bar chart will show you a bar for every milestone.
Other configuration options of the line or bar chart:
-
Remove the header altogether
-
Selecting the offset will tell you how ahead or behind the goal is from the target on the top banner of the widget
-
Selecting the "Show Sub header" will remove any of the basic information on the goal (for example owner, weighting, time allocated, dates). Go ahead and un-check any of these if they are not applicable and don't need to be seen on the dashboard.