.png?width=200&height=80&name=Classic%20Experience%20(1).png)
If you are looking for a way to display the expected versus actual progress of a goal or KPI or compare year over year data, this Snapshot is an excellent way to do so.
Here are the set up steps to create a snapshot to show expected versus actual progress for a goal or KPI.
Firstly, create a new snapshot. Select the type of snapshot, as well as the plan or plans you want to pull your goals from. Apply any necessary filters to ensure you're getting the information that you want.
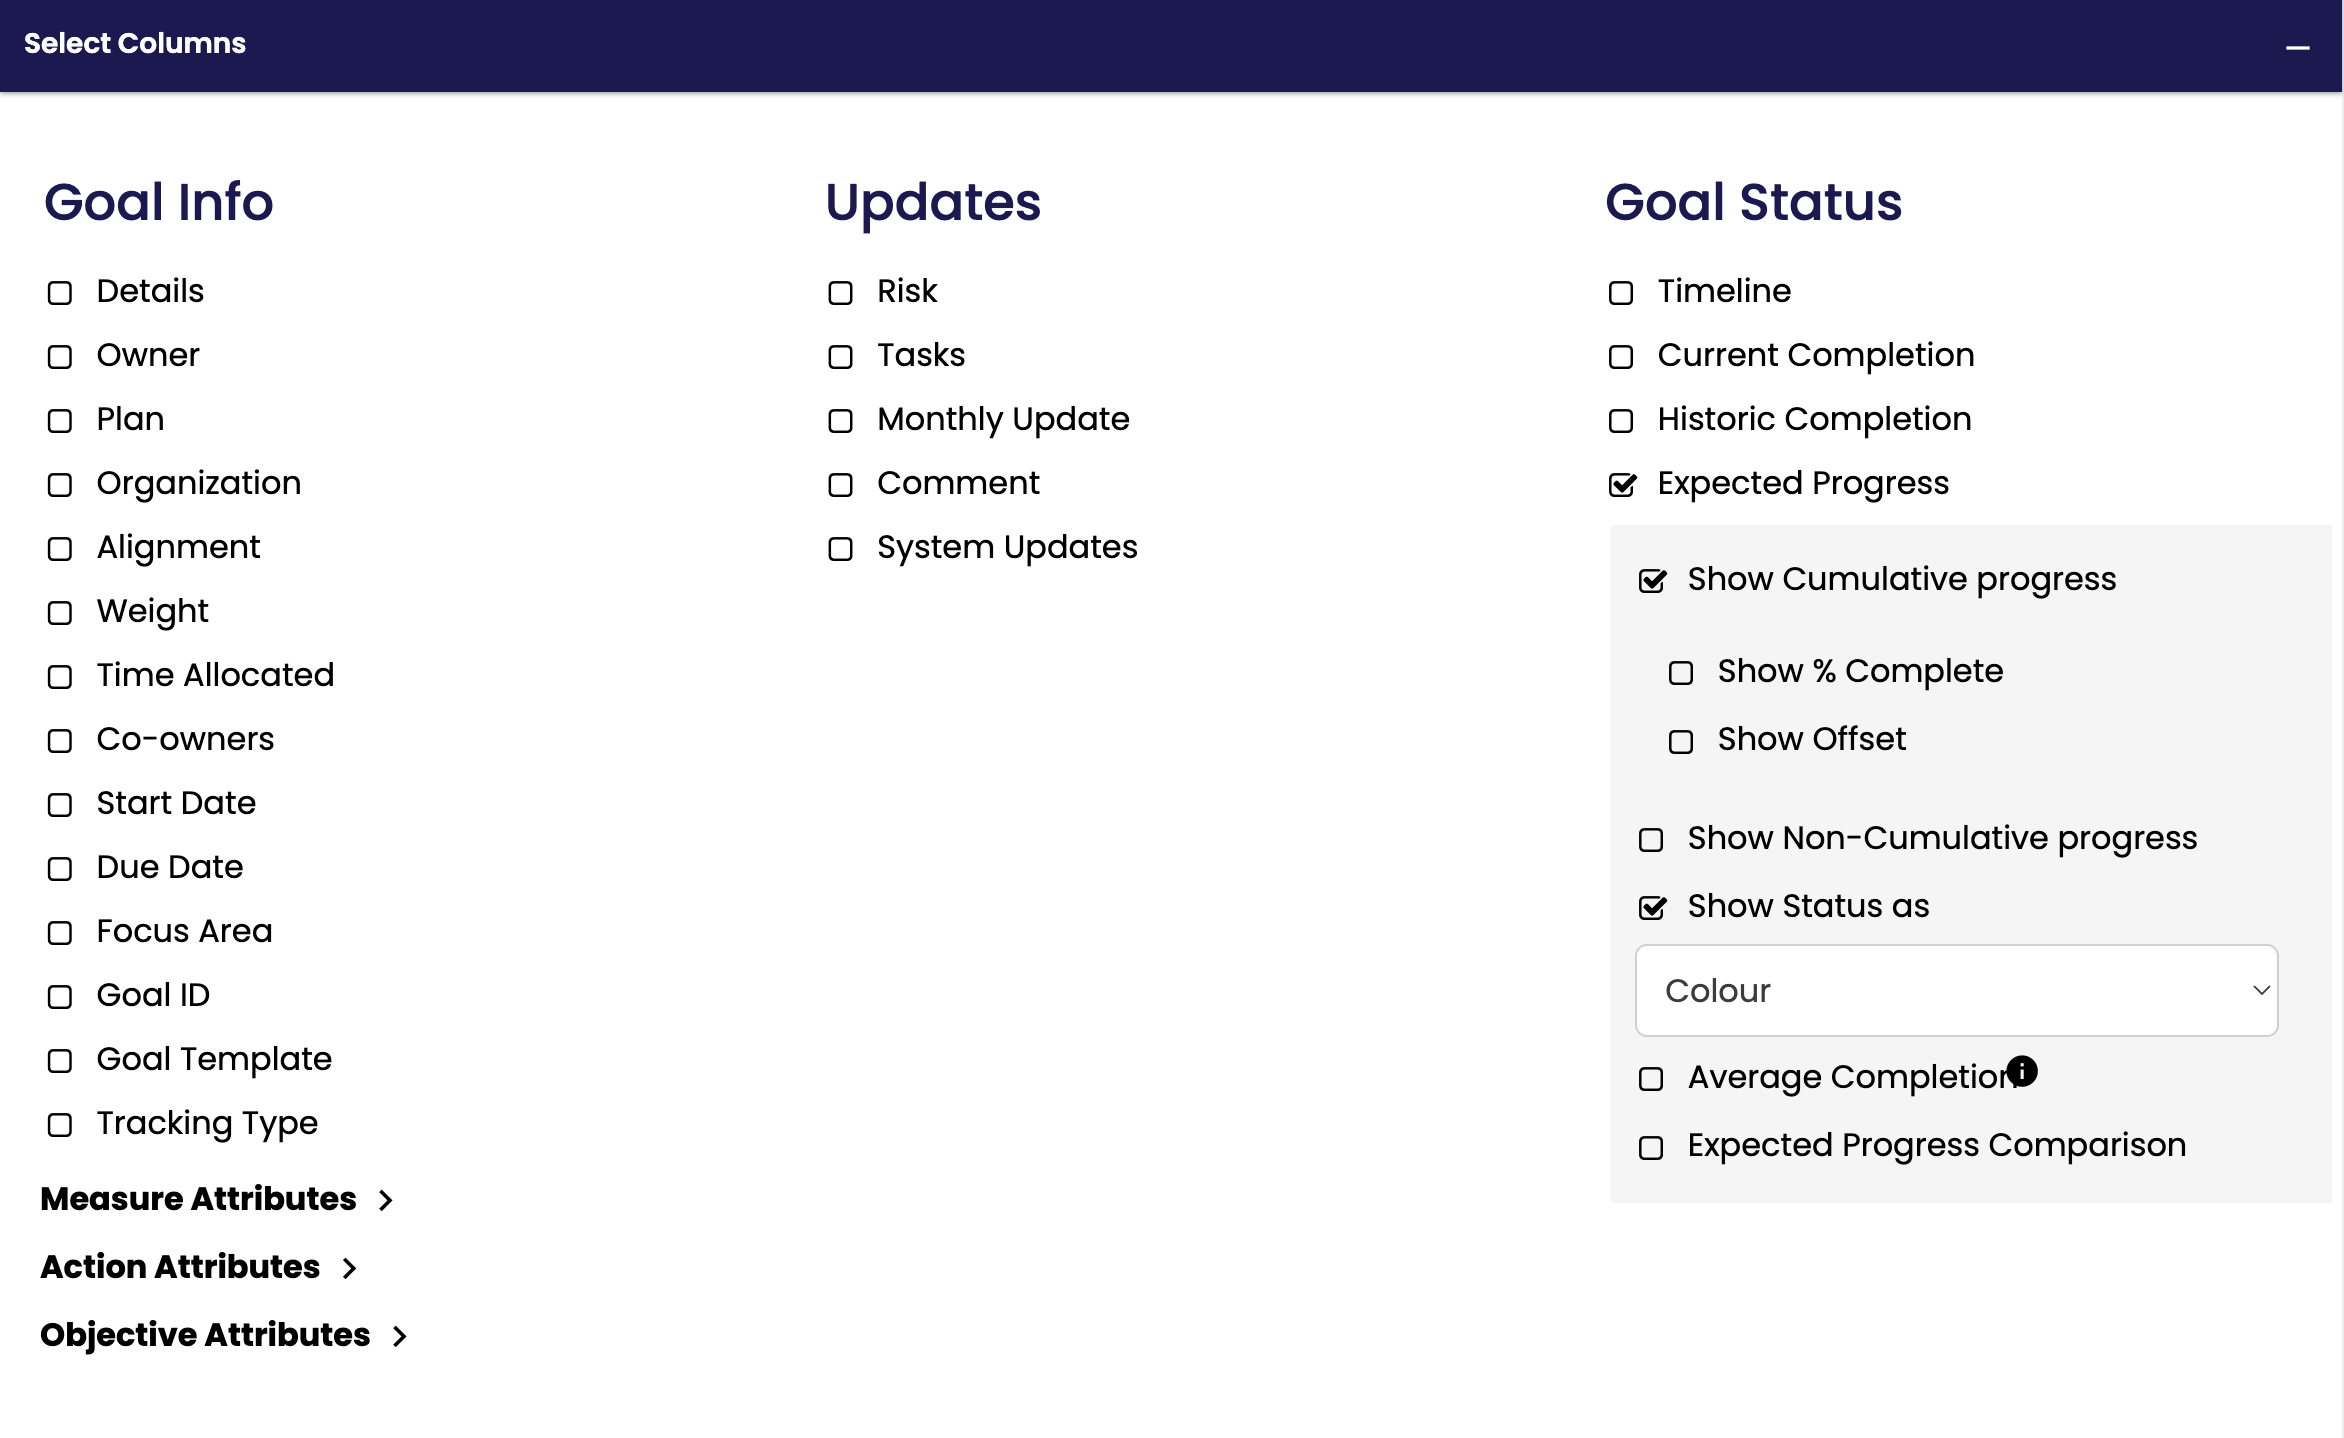
Next, under the 'Select Columns' heading, you'll want to check the following boxes: Expected Progress and Show Cumulative Progress. See image below! Adjust the column widths and titles as you prefer.
Next, generate your snapshot.
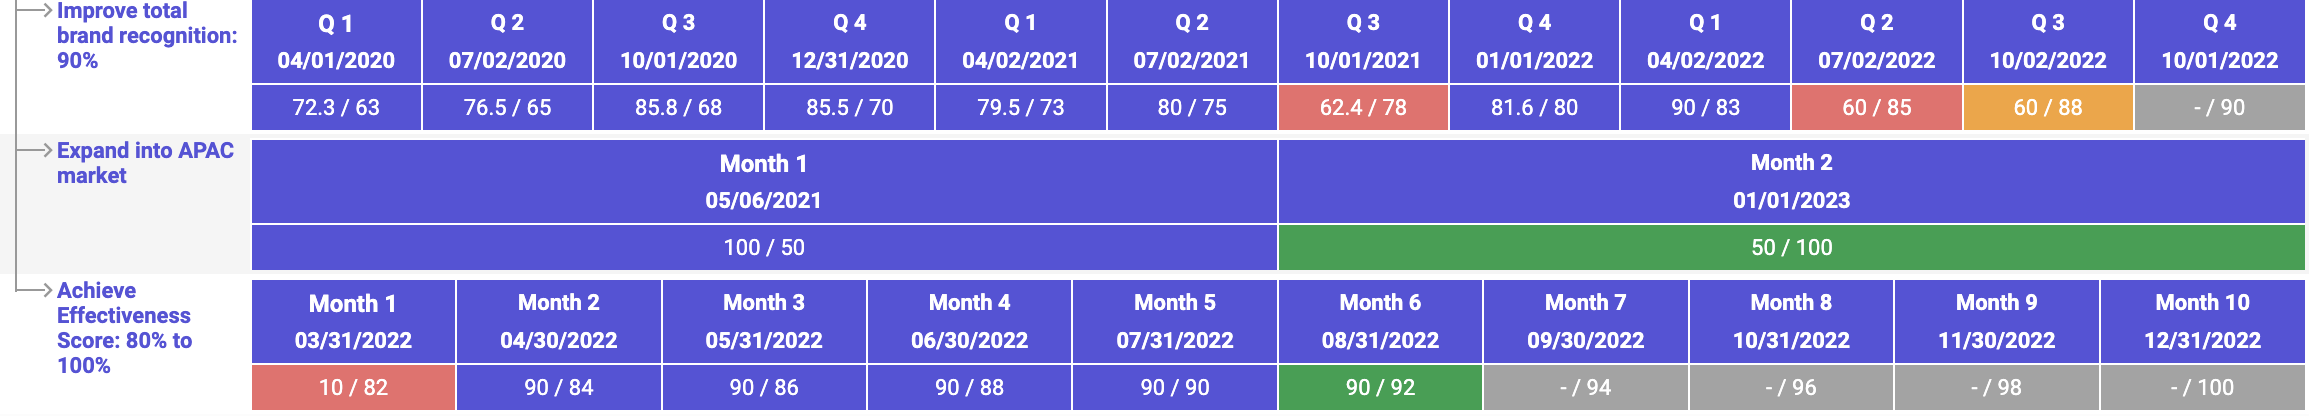
The report will generate with two columns: one listing the goal, and the second displaying the expected versus actual progress of the goal or KPI.
The progress will display in the following format: Actual / Expected. The status of the goal for each time period will be displayed in the color of the segment, if your setup matches the above screenshot. See the example below! The image shows goals with expected progress broken down by both month and quarter. This will be informed by the expected progress chart for that goal, depending on whether it has been set to weekly, monthly, quarterly, etc. For more information on expected progress, check out this article.
Note that for a snapshot of this style to display correctly, you'll want to ensure that the progress updates are added to the goals at the end of the month, as the end of the month data is what this snapshot will display.