.png?width=200&height=80&name=Classic%20Experience%20(1).png)
The dashboard page is going to be your default page when you log on, so it’s critical for it to be easy to read and compelling.
Some good examples of dashboard that we frequently recommend setting up are:
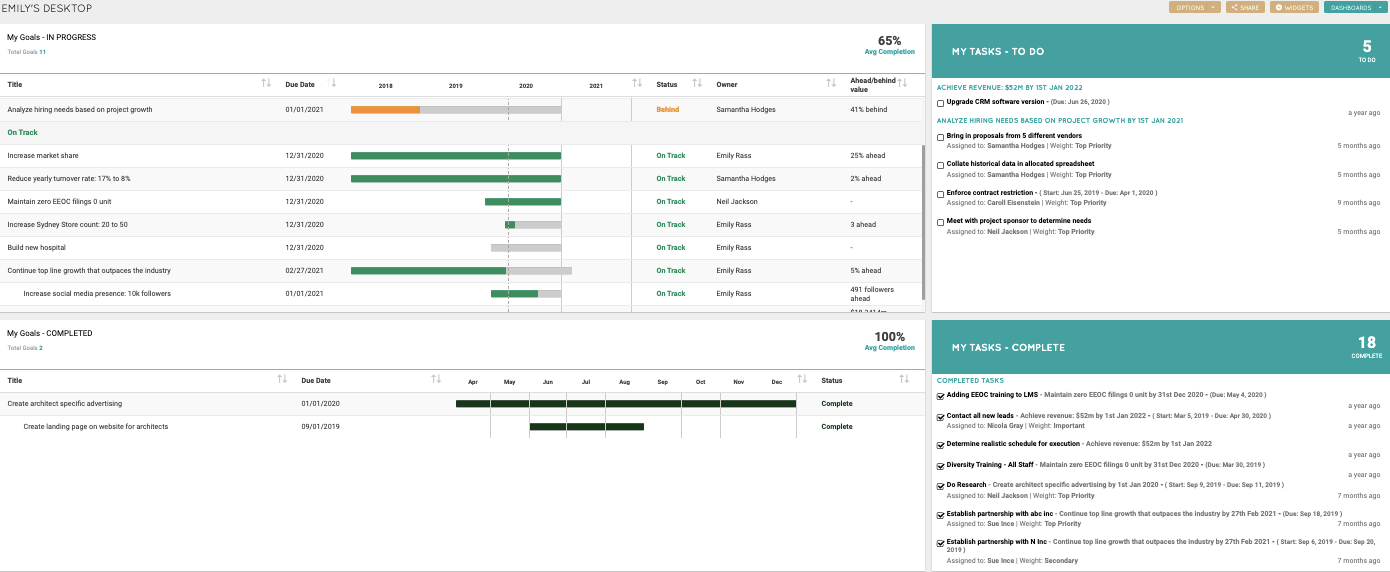
"My Dashboard"
We always recommend beginning with a “my dashboard” for end users. This dashboard should list all Goals and is different for every user. Here, we have goals that are in progress, Tasks that are outstanding, and also a link of other snapshots.
We can export this dashboard into a PDF and share it with people that do not have a Cascade subscription. If you own the dashboard, you can also share it with others.
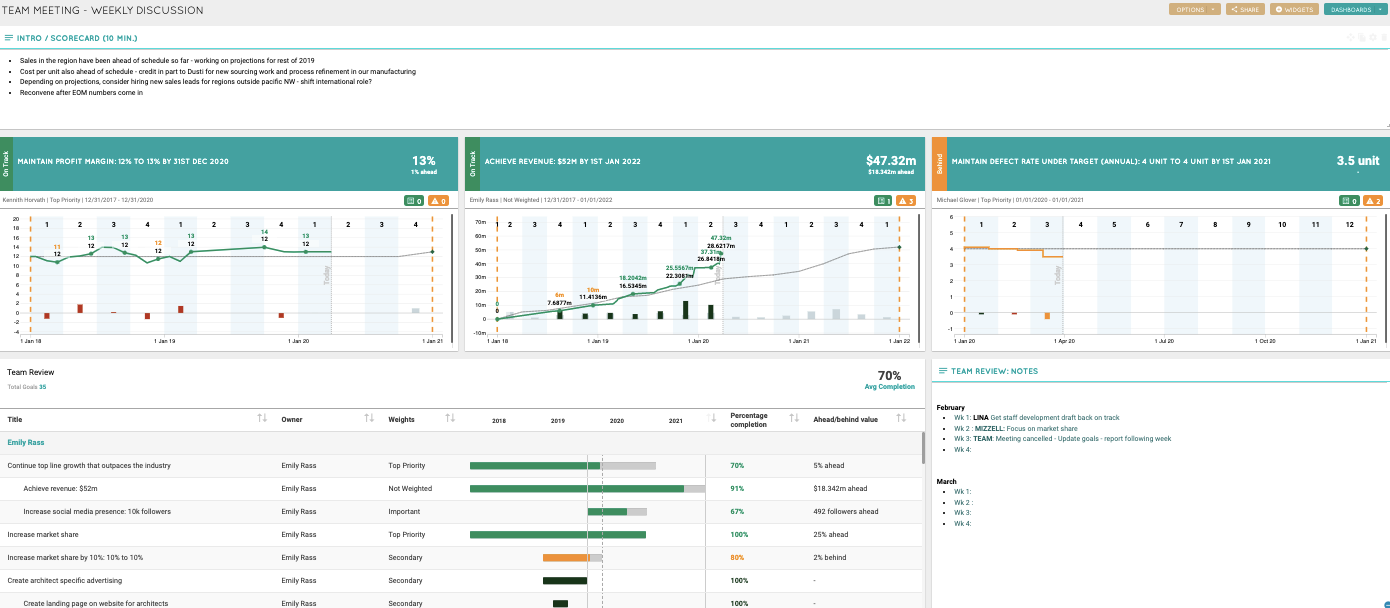
The departmental Dashboard
Another great example is a departmental dashboard.
You can see all the key projects with a status next to them (this was configurable through a formula in attributes).
You can also see the manager’s own goals, as well as some key KPIS with the historical data.
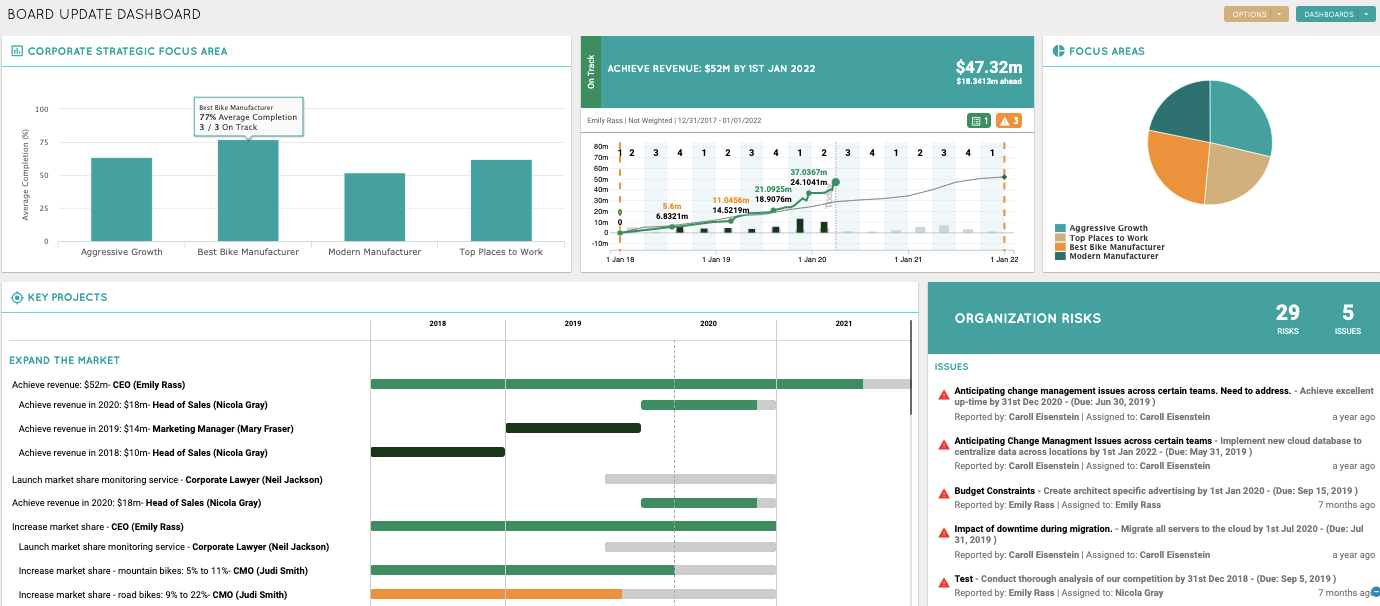
Board Dashboard
You can also have a Board Dashboard which is very high-level (for example the bar graph shows all your progress by focus area).
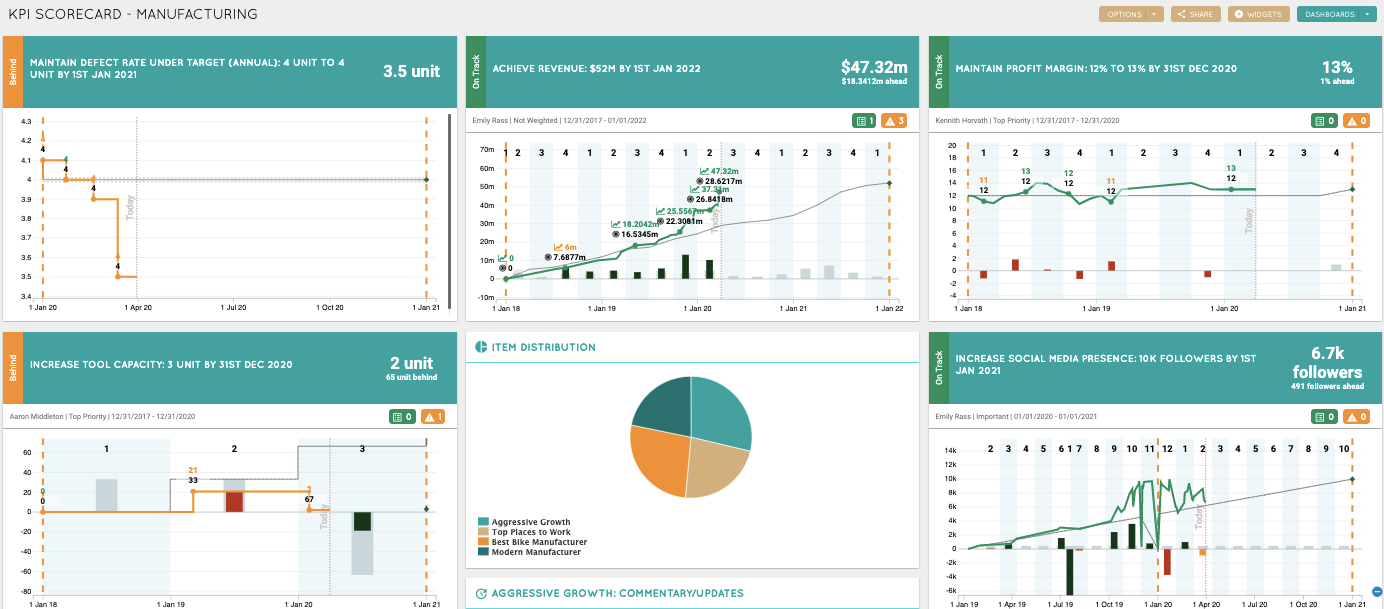
KPI Dashboard
You can also have a KPI dashboard that pulls important KPIs to focus on during a meeting. Every KPI on this dashboard can be integrated from other systems .
With this dashboard, you can go through key KPIs of a customer journey such as number of emails sent, number of website visits, number of leads generated, number of demoes, number of sales, then go through numbers in onboarding, number of at risk customers. In this way, you can go through this dashboard at a monthly company-wide town hall.
Learn more about creating your own dashboard and navigating to other dashboards in Cascade.