.png?width=200&height=80&name=Classic%20Experience%20(1).png)
When building a new goal, our Goal Designer will prompt you with the Tracking Metric section toward the bottom of it. This is where you can adjust how your goal will be measured.
The tracking setup will influence how your goal gets progress across its timeline, and ultimately what status is displayed on the goal when you are executing it (On Track, Behind, etc...).
Note: This same information can be edited for existing goals in the Tracking Tab of their respective Goal Hubs. See this article for more on that.
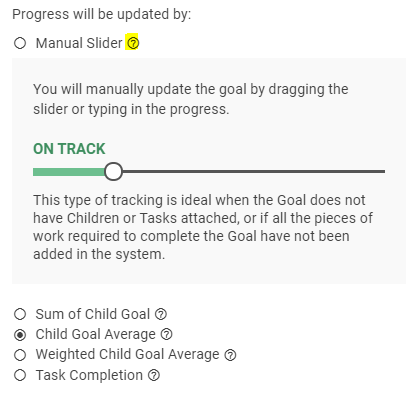
"Progress will be updated by:"
This is where you choose which Tracking Type will apply to your goal, and you can click the (?) icon to see an explanation of each.
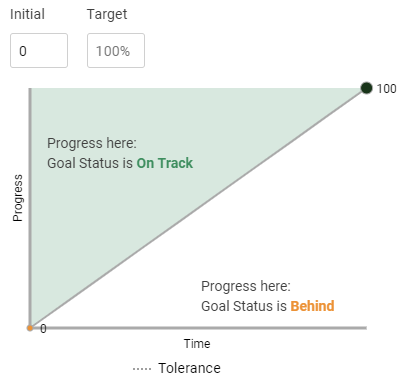
Initial and Target
Your goal will default to an initial and target of 0 to 100%, but both the initial and target values can be overwritten. As a baseline, Cascade is saying that you "want to be 100% done with this by your chosen deadline."
For example, a healthcare organization might want to reduce waiting times for patients. In this case, we'll put "80" in as our initial value (current state) and "20" in as our target (desired state). Finally, we can choose a different unit in the drop-down menu.
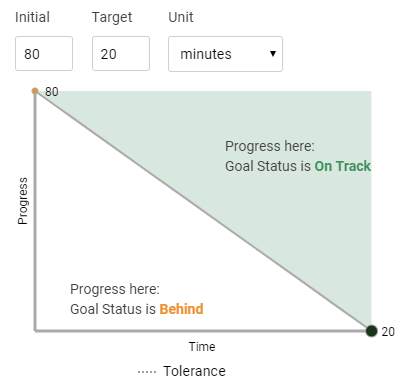
Cascade will then automatically adjust the baseline tracking curve, showing a negative trajectory. Now, "100% done" means achieving our target of 20 minutes!
"Maintain" KPIs
In rare situations, we might want to maintain a certain metric over the timeline of the goal (KPI). For example, perhaps a small movie theater wants to maintain an average of 100 people attending per day and will measure this on a monthly basis. Any time we want to track a KPI this way, the Initial and Target values should be the same.
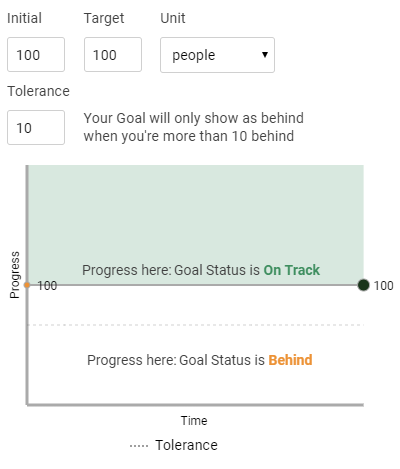
"Maintain" KPIs and Custom "Behind" Tolerance
Having the same initial and target values tells Cascade that this is a "Maintain" KPI, and you can then customize the "Behind" tolerance for it. In this example, a tolerance of "10" would mean that we could have an average as low as 90 before the KPI gets flagged as "Behind."
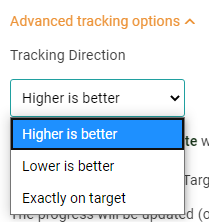
Tracking Direction
This section only needs attention if your initial value is higher than your target, or if you are working with a "Maintain" KPI (probably 1-2% of the time). This clarifies with Cascade which side of the tracking curve is favorable for your goal.
It will be "marked as complete when" options:
This section is also rarely edited. Should the goal be complete and done as soon as we hit the target, or do we need to maintain the target for the duration of your timeline?
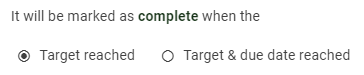
The only reason to edit this is for longer-term KPIs, or for Objectives pulling progress from those KPIs. If we have a KPI for maintaining a specific "profit per unit" or something like that, it shouldn't be marked complete if we hit one monthly target in the middle of the year - we still have several months to go!
Using "Target & due date reached" for this situation would make the KPI show up as "On Track" instead of marking it complete.
This might not be a huge deal for you, but it's worth knowing the difference. "Complete" KPIs can still have their progress updated, after all.
The progress will be updated:
This section can actually be very important. As a baseline, Cascade expects linear progress from your start date to your end date ("We should be 100% done with this by the time my end date comes around.").
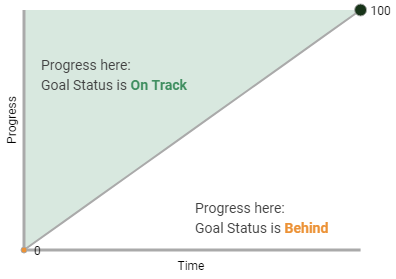
That's all well and good, but unless we're working closely in Cascade day-to-day, it can be easy to update progress so that we're "On Track" today, but have the goal show up as "Behind" by the end of the week simply because you haven't logged in since then. This isn't always realistic.
This is because Cascade is constantly measuring where you are right now against where we should be as of right now. To make sure your "On Track" status is properly maintained, use this section to tell Cascade how often to expect progress on the goal.
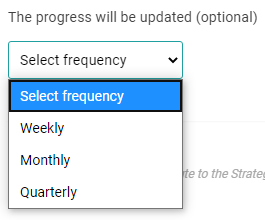
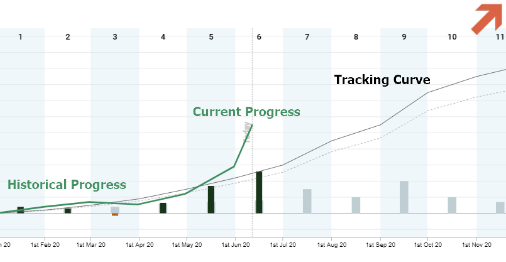
Depending on the timeline you chose, Cascade will automatically recommend reasonable cadences for updating progress (weekly, monthly, quarterly, etc.). Once you choose a cadence, the tracking curve changes to reflect it.
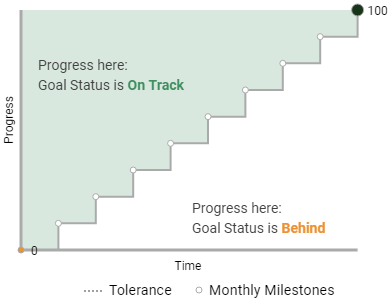
The linear line changes to "steps" of progress to reflect each monthly check-in, for example. For more information on this, see this article.